Discover today’s performance of BLOM indices, the closing prices of Lebanese stocks and Eurobonds, as well as the exchange rate of major currencies against the LBP.
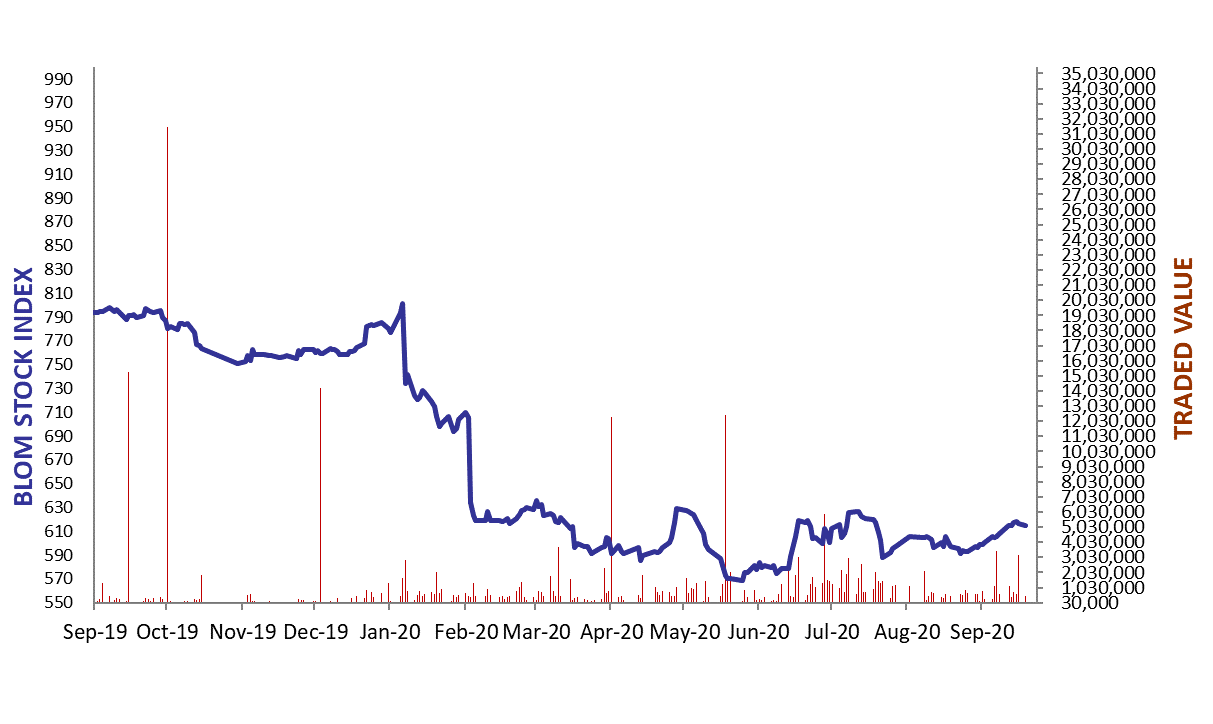
BLOM Stock Index (BSI) – today’s performance
| Last | Previous | % Change | Y-t-D Change | |
| BSI | 614.54 | 616.46 | -0.31% | -21.77% |
| High | 615.20 | 617.21 | ||
| Low | 605.42 | 615.20 | ||
| Volume | 31,214 | 3,962,766 | ||
| Val ($) | 441,519 | 3,180,736 |
I): BLOM preferred Shares Index (BPSI): today’s Performance
| Last | Last | Change | |
| BPSI | 50.16 | 50.16 | 0.00% |
| Volume | – | 24,395 | |
| Value | – | 1,103,167 |
Lebanese Stocks: today’s Trades and Closing Prices
| Last Price ($) | % Change | Volume | VWAP ($) | |
| Solidere A | 15.78 | -1.19% | 24,247 | 15.79 |
| Solidere B | 15.76 | -0.06% | 3,467 | 15.71 |
| BEMO listed shares | 1.20 | 0.00% | 3,500 | 1.20 |
Closing Date: September 21, 2020
The BLOM Stock Index
Lebanese Global Depository Receipts: Last Session’s Performance
| Global Depository Receipts (GDRs) | Last Price ($) | Previous Price ($) | % Change | Volume | Value ($) |
| BLOM GDR | 1.70 | 1.65 | 3.03% | 22,204 | 37,747 |
| Audi GDR | 0.4 | 0.4 | 0.00% |
Closing Date: September 18, 2020
Source: London Stock Exchange
BLOM BOND INDEX: Last Session’s Performance
| Last | Previous | Change | Y-t-D Change | ||
| BBI | 16.58 | 16.59 | -0.04% | -67.20% | |
| Weighted Yield | 64.38% | 64.32% | 6 | bps | |
| Duration (Years) | 2.68 | 2.68 | |||
| 5Y Bond Yield | 58.30% | 58.20% | 10 | bps | |
| 5Y Spread* | 5,830 | 5,806 | 24 | bps | |
| 10Y Bond Yield | 44.00% | 43.80% | 20 | bps | |
| 10Y Spread* | 4,400 | 4,351 | 49 | bps | |
*spread between Lebanese Eurobonds and US Treasuries
Closing Date: September 18, 2020
Lebanese Eurobonds: Last Sessions’ Prices and Yields
| Price | Yield | Yield Change | |
| 10/4/2022 | 18.00 | 124.40% | 19 |
| 1/27/2023 | 17.71 | 108.18% | 12 |
| 4/22/2024 | 17.25 | 77.27% | 5 |
| 11/4/2024 | 17.46 | 67.34% | 4 |
| 12/3/2024 | 17.42 | 69.04% | 3 |
| 2/26/2025 | 17.53 | 63.49% | 3 |
| 6/12/2025 | 18.46 | 58.49% | 2 |
| 11/28/2026 | 17.60 | 51.97% | 1 |
| 3/23/2027 | 17.38 | 52.14% | 2 |
| 11/29/2027 | 17.50 | 48.72% | 1 |
| 11/3/2028 | 17.17 | 46.37% | 1 |
| 2/26/2030 | 17.13 | 43.88% | 0 |
| 4/22/2031 | 17.00 | 44.21% | 65 |
| 3/23/2032 | 17.25 | 42.92% | 1 |
| 11/2/2035 | 17.38 | 41.12% | 0 |
| 3/23/2037 | 17.50 | 41.78% | 0 |
Lebanese Forex Market
| Last Price | Previous | % Change | Y-t-D | |
| $/LBP | 1,514.25 | 1,514.25 | – | |
| €/LBP | 1,777.79 | 1,784.88 | -0.40% | |
| £/LBP | 1,939.40 | 1,947.24 | -0.40% | |
| NEER | 127.92 | 127.43 | 0.38% |
Closing Date: September 21, 2020