Discover today’s performance of BLOM indices, the closing prices of Lebanese stocks and Eurobonds, as well as the exchange rate of major currencies against the LBP.
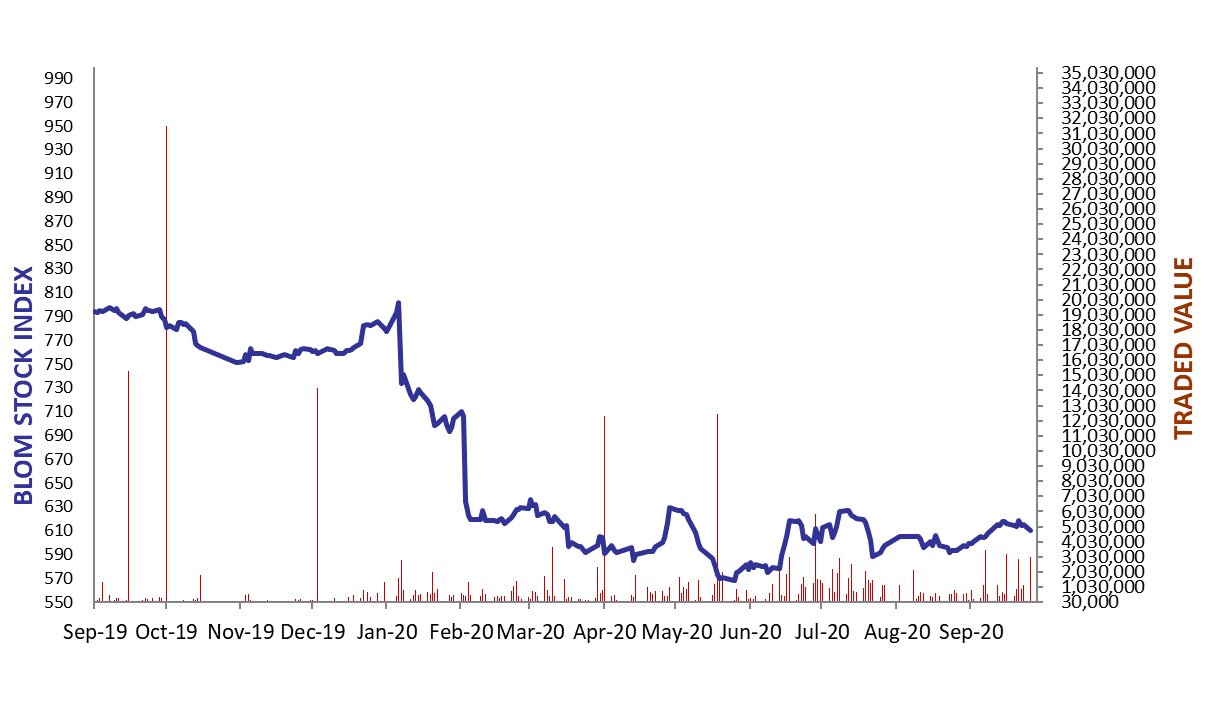
BLOM Stock Index (BSI) – today’s performance
| Last | Previous | % Change | Y-t-D Change | |
| BSI | 609.93 | 615.15 | -0.85% | -22.36% |
| High | 612.50 | 616.60 | ||
| Low | 607.20 | 611.94 | ||
| Volume | 197,410 | 76,955 | ||
| Val ($) | 2,982,670 | 1,173,736 |
I): BLOM preferred Shares Index (BPSI): today’s Performance
| Last | Previous | Change | |
| BPSI | 50.16 | 50.16 | 0.00% |
| Volume | – | – | |
| Value | – | – |
Lebanese Stocks: today’s Trades and Closing Prices
| Last Price ($) | % Change | Volume | VWAP ($) | |
| Solidere A | 15.54 | -1.71% | 113,021 | 15.49 |
| Solidere B | 15.50 | -1.96% | 78,889 | 15.50 |
| BEMO Bank Listed Sahres | 1.20 | 0.00% | 4,500 | 0.00 |
| CB(N) | 3.80 | -15.56% | 1,000 | 3.80 |
Closing Date: September 28, 2020
The BLOM Stock Index
Lebanese Global Depository Receipts: Last Session’s Performance
| Global Depository Receipts (GDRs) | Last Price ($) | Previous Price ($) | % Change | Volume | Value ($) |
| BLOM GDR | 1.70 | 1.70 | 0.00% | ||
| Audi GDR | 0.42 | 0.4 | 5.00% |
Closing Date: September 23, 2020
Source: London Stock Exchange
BLOM BOND INDEX: Last Session’s Performance
| Last | Previous | Change | Y-t-D Change | ||
| BBI | 15.59 | 15.69 | -0.66% | -69.16% | |
| Weighted Yield | 67.62% | 67.28% | 34 | bps | |
| Duration (Years) | 2.67 | 2.69 | |||
| 5Y Bond Yield | 61.40% | 61.00% | 40 | bps | |
| 5Y Spread* | 6,140 | 6,088 | 52 | bps | |
| 10Y Bond Yield | 47.65% | 47.60% | 5 | bps | |
| 10Y Spread* | 4,765 | 4,734 | 31 | bps | |
*spread between Lebanese Eurobonds and US Treasuries
Closing Date: September 25, 2020
Lebanese Eurobonds: Last Sessions’ Prices and Yields
| Price | Yield | Yield Change | |
| 10/4/2022 | 17.00 | 131.05% | 21 |
| 1/27/2023 | 16.82 | 113.01% | 101 |
| 4/22/2024 | 16.25 | 80.85% | 6 |
| 11/4/2024 | 16.53 | 70.16% | 32 |
| 12/3/2024 | 16.33 | 72.38% | 4 |
| 2/26/2025 | 16.36 | 66.72% | 49 |
| 6/12/2025 | 17.23 | 61.52% | 27 |
| 11/28/2026 | 16.39 | 54.77% | 52 |
| 3/23/2027 | 16.38 | 54.53% | 1 |
| 11/29/2027 | 16.39 | 51.21% | 50 |
| 11/3/2028 | 16.21 | 48.48% | 37 |
| 2/26/2030 | 16.13 | 46.04% | 0 |
| 4/22/2031 | 16.04 | 46.47% | 64 |
| 3/23/2032 | 16.27 | 45.19% | 61 |
| 11/2/2035 | 16.38 | 43.48% | 0 |
| 3/23/2037 | 16.38 | 44.56% | 32 |
Lebanese Forex Market
| Last Price | Previous | % Change | Y-t-D | |
| $/LBP | 1,514.25 | 1,514.25 | – | |
| €/LBP | 1,757.14 | 1,753.37 | 0.21% | |
| £/LBP | 1,944.68 | 1,921.25 | 1.22% | |
| NEER | 129.18 | 128.53 | 0.51% |
Closing Date: September 28, 2020