
Discover today’s performance of BLOM indices, the closing prices of Lebanese stocks and Eurobonds, as well as the exchange rate of major currencies against the LBP.
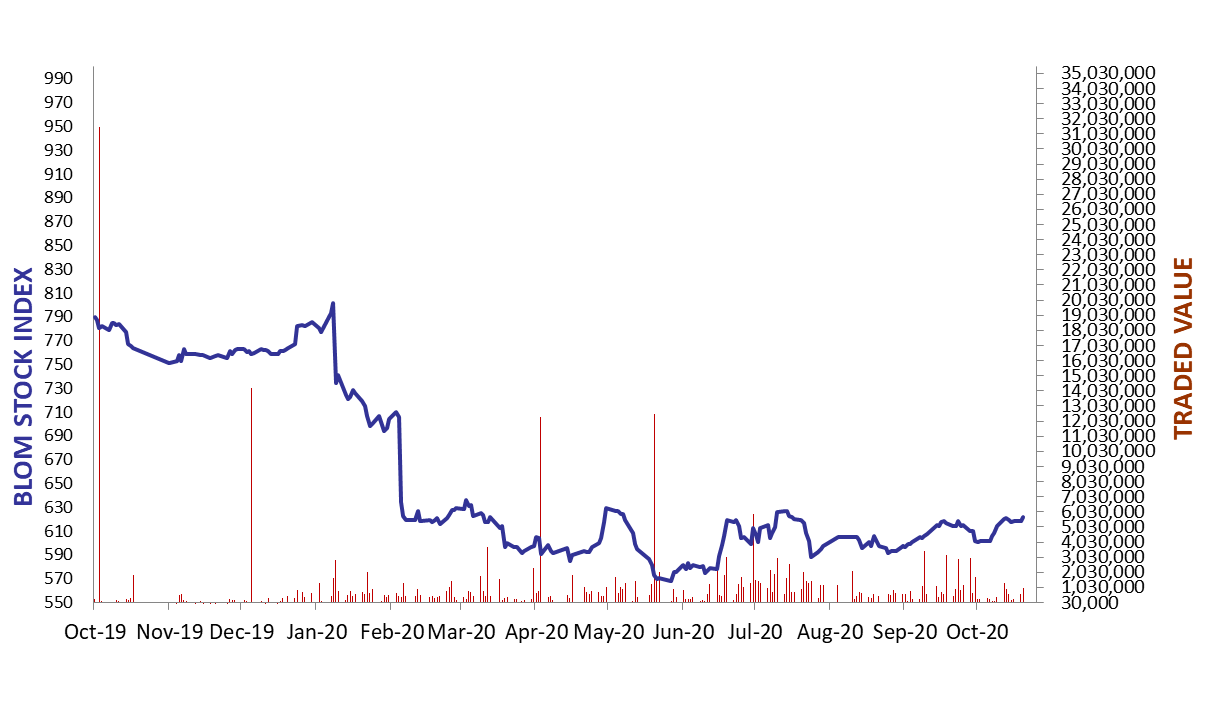
BLOM Stock Index (BSI) – today’s performance
| Last | Previous | % Change | Y-t-D Change | |
| BSI | 621.46 | 618.46 | 0.48% | -20.89% |
| High | 622.23 | 619.24 | ||
| Low | 620.18 | 617.19 | ||
| Volume | 96,134 | 42,858 | ||
| Val ($) | 967,473 | 601,448 |
I): BLOM preferred Shares Index (BPSI): today’s Performance
| Last | Previous | Change | |
| BPSI | 48.75 | 48.75 | 0.00% |
| Volume | – | – | |
| Value | – | – |
Lebanese Stocks: today’s Trades and Closing Prices
| Last Price ($) | % Change | Volume | VWAP ($) | |
| Solidere A | 15.97 | 0.31% | 42,720 | 15.80 |
| Solidere B | 15.79 | -0.44% | 12,514 | 15.79 |
| Byblos bank – Listed Shares | 0.45 | 12.50% | 3,900 | 0.45 |
| BEMO – Listed Shares | 1.20 | 0.00% | 3,000 | 1.20 |
| BLOM GDR | 2.64 | -0.38% | 34,000 | 2.60 |
Closing Date: October 20, 2020
The BLOM Stock Index
Lebanese Global Depository Receipts: Last Session’s Performance
| Global Depository Receipts (GDRs) | Last Price ($) | Previous Price ($) | % Change | Volume | Value ($) |
| BLOM GDR | 0.50 | 0.60 | -16.67% | 19,185 | 9,593 |
| Audi GDR | 0.38 | 0.38 | 0.00% |
Closing Date: October 19, 2020
Source: London Stock Exchange
BLOM BOND INDEX: Last Session’s Performance
| Last | Previous | Change | Y-t-D Change | ||
| BBI | 13.56 | 13.42 | 1.05% | -73.17% | |
| Weighted Yield | 76.08% | 76.56% | -48 | bps | |
| Duration (Years) | 2.41 | 2.40 | |||
| 5Y Bond Yield | 68.30% | 68.00% | 30 | bps | |
| 5Y Spread* | 6,830 | 6,784 | 46 | bps | |
| 10Y Bond Yield | 53.50% | 53.70% | -20 | bps | |
| 10Y Spread* | 5,350 | 5,336 | 14 | bps | |
*spread between Lebanese Eurobonds and US Treasuries
Closing Date: October 19, 2020
| Price | Yield | Yield Change | |
| 10/4/2022 | 14.84 | 149.29% | (175) |
| 1/27/2023 | 14.37 | 129.27% | 70 |
| 4/22/2024 | 14.10 | 90.57% | (128) |
| 11/4/2024 | 14.25 | 78.68% | 7 |
| 12/3/2024 | 14.14 | 81.03% | (137) |
| 2/26/2025 | 14.12 | 74.35% | 21 |
| 6/12/2025 | 14.89 | 68.63% | 27 |
| 11/28/2026 | 14.28 | 60.78% | 11 |
| 3/23/2027 | 14.25 | 60.51% | (114) |
| 11/29/2027 | 14.25 | 57.09% | 19 |
| 11/3/2028 | 14.08 | 54.36% | 25 |
| 2/26/2030 | 14.10 | 51.33% | (145) |
| 4/22/2031 | 14.20 | 51.94% | (13) |
| 3/23/2032 | 14.30 | 50.62% | (23) |
| 11/2/2035 | 14.26 | 49.79% | (88) |
| 3/23/2037 | 14.09 | 51.50% | (35) |
Lebanese Eurobonds: Last Sessions’ Prices and Yields
| Last Price | Previous | % Change | Y-t-D | |
| $/LBP | 1,514.25 | 1,514.25 | – | |
| €/LBP | 1,781.11 | 1,774.18 | 0.39% | |
| £/LBP | 1,952.36 | 1,951.91 | 0.02% | |
| NEER | 128.17 | 128.32 | -0.12% |
Lebanese Forex Market
Closing Date: October 20, 2020