
Discover today’s performance of BLOM indices, the closing prices of Lebanese stocks and Eurobonds, as well as the exchange rate of major currencies against the LBP.
BLOM Stock Index (BSI) – today’s performance
| Last | Previous | % Change | Y-t-D Change | |
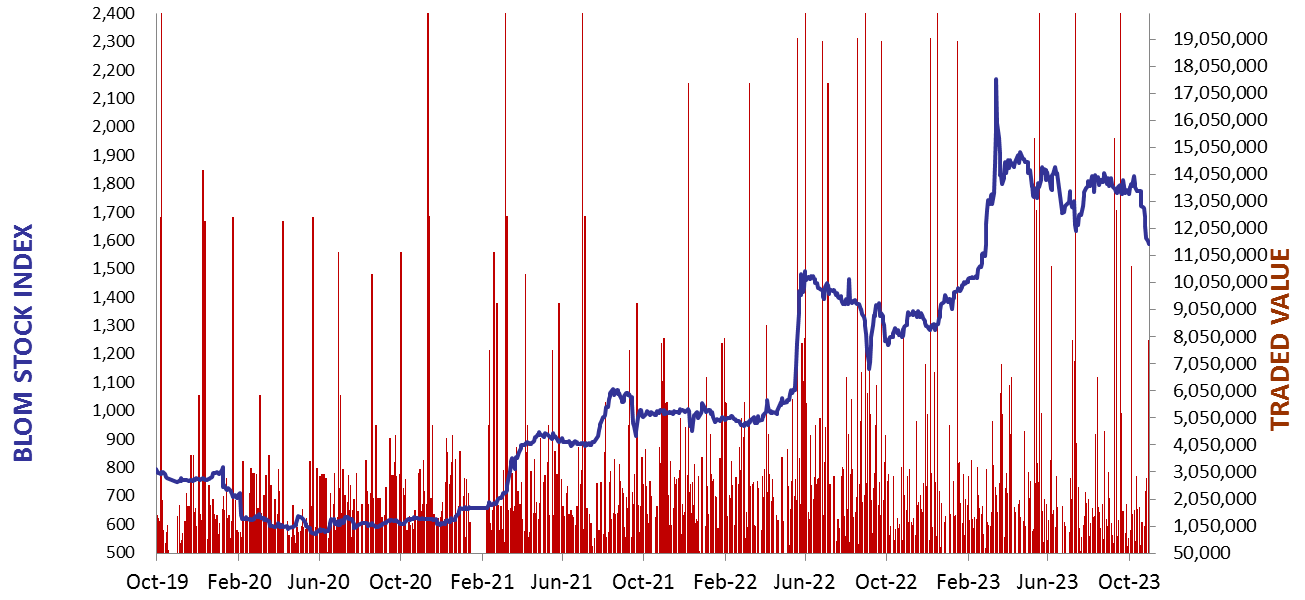
| BSI | 1,614.22 | 1,627.15 | -0.79% | 16.64% |
| High | 1,627.15 | 1,627.15 | ||
| Low | 1,611.78 | 1,618.95 | ||
| Volume | 10,611 | 3,500 | ||
| Val ($) | 722,082 | 241,248 |
I): BLOM preferred Shares Index (BPSI): today’s Performance
| Last | Previous | Change | |
| BPSI | 39.62 | 39.62 | 0.00% |
| Volume | |||
| Value |
Lebanese Stocks: today’s Trades and Closing Prices
| Last Price ($) | % Change | Volume | VWAP ($) | |
| Solidere A | 69.25 | 0.44% | 8,958 | 68.52 |
| Solidere B | 65.5 | -3.68% | 1,653 | 65.5 |
Closing Date: November 16, 2023
The BLOM Stock Index
BLOM BOND INDEX: Last Session’s Performance
| Last | Previous | Change | Y-t-D Change | ||
| BBI | 5.86 | 5.90 | -0.65% | -2.75% | |
| Weighted Yield | 210.95% | 209.54% | 141 | bps | |
| Duration (Years) | 1.26 | 1.27 | |||
| 5Y Bond Yield | 158.90% | 158.20% | 70 | bps | |
| 5Y Spread* | 15,363 | 15,296 | 67 | bps | |
| 10Y Bond Yield | 114.55% | 114.00% | 55 | bps | |
| 10Y Spread* | 10,987 | 10,944 | 43 | bps |
*spread between Lebanese Eurobonds and US Treasuries
| Price | Yield | Yield Change | |
| 04/11/2024 | 6.03 | 710.08% | 584 |
| 03/12/2024 | 6.00 | 618.38% | 777 |
| 26/02/2025 | 6.03 | 438.95% | 220 |
| 12/06/2025 | 6.08 | 334.84% | 413 |
| 28/11/2026 | 6.02 | 171.32% | 62 |
| 23/03/2027 | 6.01 | 158.86% | 66 |
| 29/11/2027 | 6.06 | 140.10% | 55 |
| 03/11/2028 | 6.02 | 125.20% | 75 |
| 26/02/2030 | 6.06 | 112.78% | 43 |
| 22/04/2031 | 6.01 | 116.82% | 74 |
| 23/03/2032 | 6.02 | 114.26% | 40 |
| 02/11/2035 | 6.03 | 116.03% | 117 |
| 23/03/2037 | 6.10 | 115.77% | 77 |
Closing Date: November 15, 2023
Lebanese Forex Market
| Last Price | Previous | % Change | |
| $/LBP | 15,000 | 15,000 | – |
| €/LBP | 16,285.50 | 16,272.00 | 0.08% |
| £/LBP | 18,600.00 | 18,624.00 | -0.13% |
| NEER | 239.77 | 239.79 | -0.01% |
Closing Date: November 16, 2023