
Discover today’s performance of BLOM indices, the closing prices of Lebanese stocks and Eurobonds, as well as the exchange rate of major currencies against the LBP.
BLOM Stock Index (BSI) – today’s performance
| Last | Previous | % Change | Y-t-D Change | |
| BSI | 1,666.35 | 1,647.42 | 1.15% | 20.41% |
| High | 1,672.30 | 1,653.27 | ||
| Low | 1,647.42 | 1,621.07 | ||
| Volume | 3,420 | 32,384 | ||
| Val ($) | 238,020 | 474,966 |
I): BLOM preferred Shares Index (BPSI): today’s Performance
| Last | Previous | Change | |
| BPSI | 39.62 | 39.62 | 0.00% |
| Volume | |||
| Value |
Lebanese Stocks: today’s Trades and Closing Prices
| Last Price ($) | % Change | Volume | VWAP ($) | |
| Solidere A | 69.65 | 0.36% | 420 | 69.65 |
| Solidere B | 69.6 | 3.88% | 3,000 | 69.59 |
Closing Date: November 27, 2023
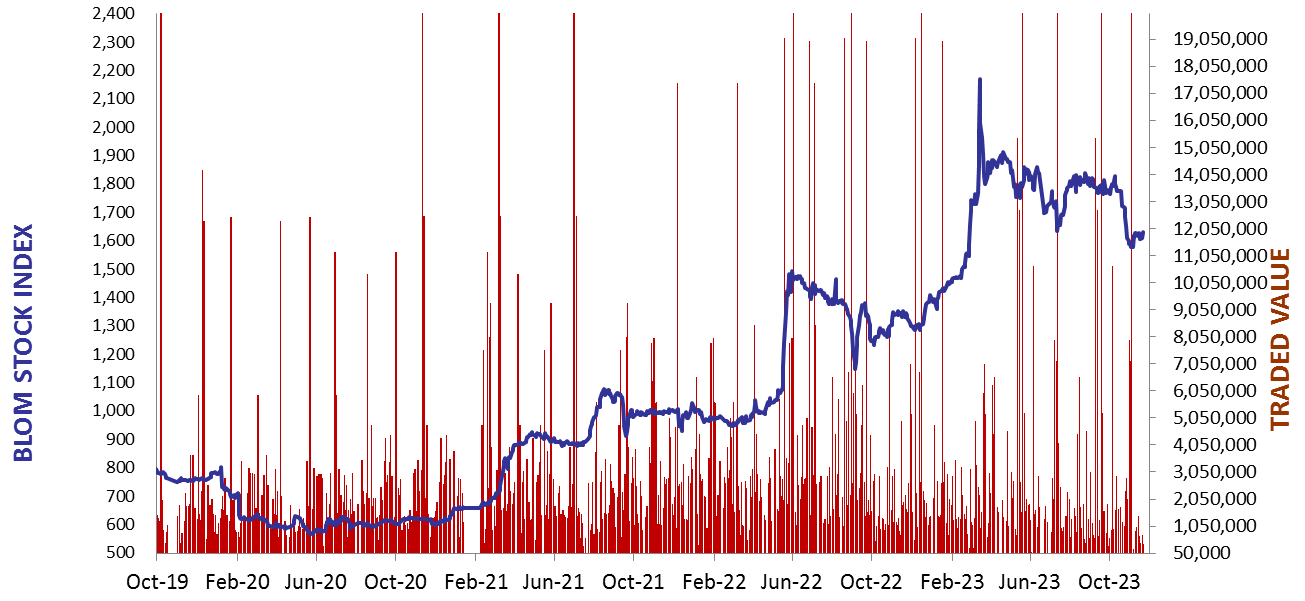
The BLOM Stock Index
BLOM BOND INDEX: Last Session’s Performance
| Last | Previous | Change | Y-t-D Change | ||
| BBI | 5.82 | 5.79 | 0.54% | -3.52% | |
| Weighted Yield | 216.33% | 216.51% | -17 | bps | |
| Duration (Years) | 1.23 | 1.23 | |||
| 5Y Bond Yield | 160.10% | 160.60% | -50 | bps | |
| 5Y Spread* | 15,483 | 15,534 | -51 | bps | |
| 10Y Bond Yield | 114.90% | 115.10% | -20 | bps | |
| 10Y Spread* | 11,023 | 11,048 | -25 | bps |
*spread between Lebanese Eurobonds and US Treasuries
| Price | Yield | Yield Change | |
| 04/11/2024 | 5.96 | 742.17% | 91 |
| 03/12/2024 | 5.79 | 667.45% | 1,103 |
| 26/02/2025 | 5.97 | 453.52% | (76) |
| 12/06/2025 | 6.08 | 343.78% | (56) |
| 28/11/2026 | 5.97 | 174.37% | (31) |
| 23/03/2027 | 5.97 | 160.05% | (53) |
| 29/11/2027 | 6.03 | 141.69% | (76) |
| 03/11/2028 | 5.97 | 125.86% | (33) |
| 26/02/2030 | 6.04 | 113.15% | (75) |
| 22/04/2031 | 5.97 | 117.02% | (47) |
| 23/03/2032 | 5.98 | 114.78% | (41) |
| 02/11/2035 | 5.97 | 116.45% | (50) |
| 23/03/2037 | 6.00 | 117.28% | (3) |
Closing Date: November 24, 2023
Lebanese Forex Market
| Last Price | Previous | % Change | |
| $/LBP | 15,000 | 15,000 | – |
| €/LBP | 16,432.50 | 16,408.50 | 0.15% |
| £/LBP | 18,937.50 | 18,904.50 | 0.17% |
| NEER | 239.97 | 239.99 | -0.01% |
Closing Date: November 27, 2023