
Discover today’s performance of BLOM indices, the closing prices of Lebanese stocks and Eurobonds, as well as the exchange rate of major currencies against the LBP.
BLOM Stock Index (BSI) – today’s performance
| Last | Previous | % Change | Y-t-D Change | |
| BSI | 1,666.97 | 1,652.09 | 0.90% | 20.45% |
| High | 1,690.46 | 1,665.73 | ||
| Low | 1,643.22 | 1,641.39 | ||
| Volume | 38,790 | 24,646 | ||
| Val ($) | 2,714,643 | 1,711,020 |
I): BLOM preferred Shares Index (BPSI): today’s Performance
| Last | Previous | Change | |
| BPSI | 39.62 | 39.62 | 0.00% |
| Volume | |||
| Value |
Lebanese Stocks: today’s Trades and Closing Prices
| Last Price ($) | % Change | Volume | VWAP ($) | |
| Solidere A | 69.9 | -0.14% | 17,230 | 69.92 |
| Solidere B | 70.35 | 3.68% | 21,560 | 70.03 |
Closing Date: December 08, 2023
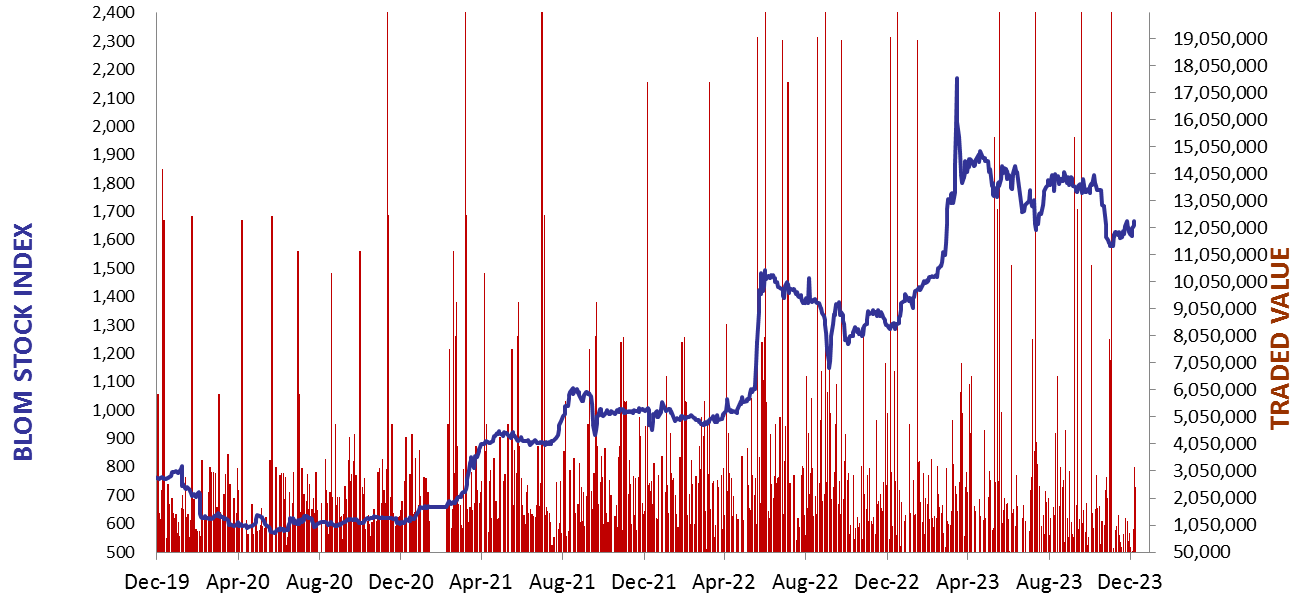
The BLOM Stock Index
BLOM BOND INDEX: Last Session’s Performance
| Last | Previous | Change | Y-t-D Change | ||
| BBI | 5.78 | 5.76 | 0.40% | -4.18% | |
| Weighted Yield | 223.35% | 223.54% | -19 | bps | |
| Duration (Years) | 1.34 | 1.34 | |||
| 5Y Bond Yield | 161.30% | 161.80% | -50 | bps | |
| 5Y Spread* | 15,617 | 15,675 | -58 | bps | |
| 10Y Bond Yield | 115.20% | 115.80% | -60 | bps | |
| 10Y Spread* | 11,075 | 11,149 | -74 | bps |
*spread between Lebanese Eurobonds and US Treasuries
| Price | Yield | Yield Change | |
| 04/11/2024 | 5.92 | 793.06% | 104 |
| 03/12/2024 | 6.00 | 703.44% | 253 |
| 26/02/2025 | 5.92 | 476.75% | (35) |
| 12/06/2025 | 6.14 | 357.67% | 3 |
| 28/11/2026 | 5.92 | 176.75% | (45) |
| 23/03/2027 | 5.95 | 161.44% | (27) |
| 29/11/2027 | 5.93 | 143.99% | (20) |
| 03/11/2028 | 5.94 | 126.01% | (68) |
| 26/02/2030 | 5.92 | 115.08% | (29) |
| 22/04/2031 | 5.91 | 117.48% | 19 |
| 23/03/2032 | 5.94 | 115.09% | (62) |
| 02/11/2035 | 5.96 | 115.88% | (41) |
| 23/03/2037 | 5.95 | 117.98% | (17) |
Closing Date: December 8, 2023
Lebanese Forex Market
| Last Price | Previous | % Change | |
| $/LBP | 15,000 | 15,000 | – |
| €/LBP | 16,152.00 | 16,144.50 | 0.05% |
| £/LBP | 18,810.00 | 18,823.50 | -0.07% |
| NEER | 240.60 | 240.56 | 0.02% |
Closing Date: December 11, 2023