
Discover today’s performance of BLOM indices, the closing prices of Lebanese stocks and Eurobonds, as well as the exchange rate of major currencies against the LBP.
BLOM Stock Index (BSI) – today’s performance
| Last | Previous | % Change | Y-t-D Change | |
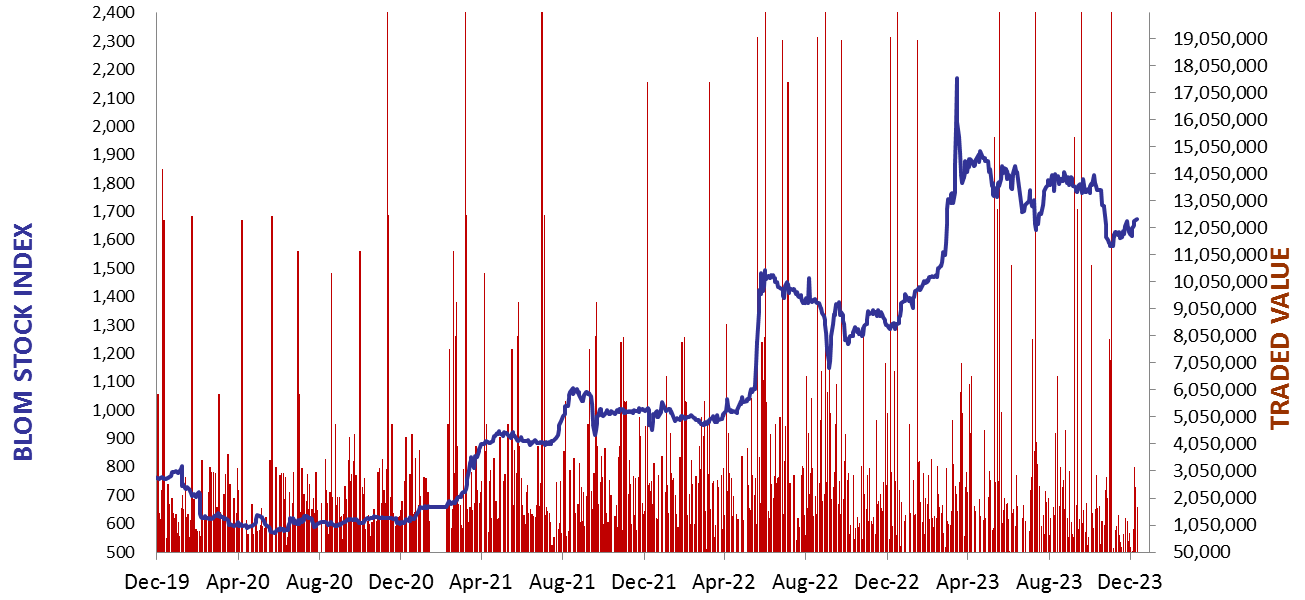
| BSI | 1,943.13 | 1,992.72 | -2.49% | 40.41% |
| High | 1,992.72 | 1,997.99 | ||
| Low | 1,899.69 | 1,889.00 | ||
| Volume | 92,734 | 10,600 | ||
| Val ($) | 8,030,144 | 931,944 |
I): BLOM preferred Shares Index (BPSI): today’s Performance
| Last | Previous | Change | |
| BPSI | 39.62 | 39.62 | 0.00% |
| Volume | |||
| Value |
Lebanese Stocks: today’s Trades and Closing Prices
| Last Price ($) | % Change | Volume | VWAP ($) | |
| Solidere A | 86.1 | -4.17% | 88,223 | 86.63 |
| Solidere B | 86.35 | -2.32% | 4,511 | 85.82 |
Closing Date: December 22, 2023
The BLOM Stock Index
BLOM BOND INDEX: Last Session’s Performance
| Last | Previous | Change | Y-t-D Change | ||
| BBI | 5.84 | 5.85 | -0.20% | -3.24% | |
| Weighted Yield | 227.98% | 227.30% | 68 | bps | |
| Duration (Years) | 1.34 | 1.34 | |||
| 5Y Bond Yield | 162.00% | 161.70% | 30 | bps | |
| 5Y Spread* | 15,716 | 15,682 | 34 | bps | |
| 10Y Bond Yield | 114.10% | 113.85% | 25 | bps | |
| 10Y Spread* | 11,004 | 10,979 | 25 | bps |
*spread between Lebanese Eurobonds and US Treasuries
| Price | Yield | Yield Change | |
| 04/11/2024 | 5.96 | 840.95% | 645 |
| 03/12/2024 | 6.02 | 737.14% | (635) |
| 26/02/2025 | 5.96 | 497.46% | 243 |
| 12/06/2025 | 6.21 | 366.03% | 223 |
| 28/11/2026 | 5.96 | 176.80% | 35 |
| 23/03/2027 | 5.99 | 161.99% | 26 |
| 29/11/2027 | 6.01 | 142.68% | 59 |
| 03/11/2028 | 5.98 | 125.47% | (24) |
| 26/02/2030 | 6.02 | 113.88% | 22 |
| 22/04/2031 | 5.99 | 115.77% | (11) |
| 23/03/2032 | 6.00 | 113.96% | 24 |
| 02/11/2035 | 6.00 | 114.72% | (4) |
| 23/03/2037 | 6.01 | 116.61% | 10 |
Closing Date: December 21, 2023
Lebanese Forex Market
| Last Price | Previous | % Change | |
| $/LBP | 15,000 | 15,000 | – |
| €/LBP | 16,510.50 | 16,512.00 | -0.01% |
| £/LBP | 19,027.50 | 19,032.00 | -0.02% |
| NEER | 240.71 | 240.59 | 0.05% |
Closing Date: December 22, 2023