
Discover today’s performance of BLOM indices, the closing prices of Lebanese stocks and Eurobonds, as well as the exchange rate of major currencies against the LBP.
BLOM Stock Index (BSI) – today’s performance
| Last | Previous | % Change | Y-t-D Change | |
| BSI | 1,889.79 | 1,938.82 | -2.53% | -4.22% |
| High | 1,948.68 | 1,955.73 | ||
| Low | 1,889.79 | 1,898.03 | ||
| Volume | 65,361 | 13,602 | ||
| Val ($) | 1,247,433 | 750,234 |
I): BLOM preferred Shares Index (BPSI): today’s Performance
| Last | Previous | Change | |
| BPSI | 39.62 | 39.62 | 0.00% |
| Volume | |||
| Value |
Lebanese Stocks: today’s Trades and Closing Prices
| Last Price ($) | % Change | Volume | VWAP ($) | |
| Solidere A | 83.55 | -3.19% | 13,310 | 83.29 |
| Solidere B | 83.85 | -4.01% | 1,201 | 83.87 |
| Byblos Listed shares | 0.75 | 0.00% | 50,850 | 0.7 |
Closing Date: February 16, 2024
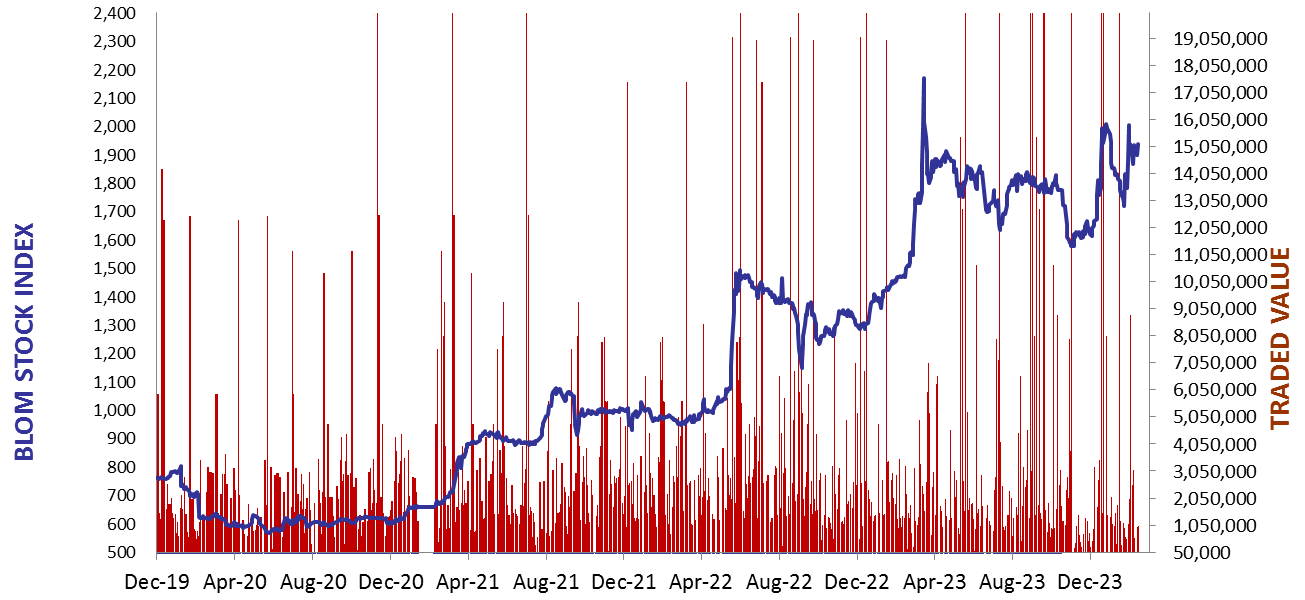
The BLOM Stock Index
BLOM BOND INDEX: Last Session’s Performance
| Last | Previous | Change | Y-t-D Change | ||
| BBI | 5.22 | 5.22 | -0.01% | -13.44% | |
| Weighted Yield | 207.43% | 206.81% | 62 | bps | |
| Duration (Years) | 1.16 | 1.17 | |||
| 5Y Bond Yield | 120.70% | 120.90% | -20 | bps | |
| 5Y Spread* | 11,577 | 11,591 | -14 | bps | |
| 10Y Bond Yield | 118.70% | 119.10% | -40 | bps | |
| 10Y Spread* | 11,434 | 11,466 | -32 | bps |
*spread between Lebanese Eurobonds and US Treasuries
| Price | Yield | Yield Change | |
| 26/02/2025 | 5.84 | 648.89% | 109 |
| 12/06/2025 | 5.94 | 423.69% | 249 |
| 28/11/2026 | 5.82 | 184.99% | (80) |
| 23/03/2027 | 5.79 | 172.77% | 82 |
| 29/11/2027 | 5.73 | 148.72% | 62 |
| 03/11/2028 | 5.77 | 129.76% | (71) |
| 26/02/2030 | 5.79 | 120.48% | (35) |
| 22/04/2031 | 5.63 | 122.12% | 93 |
| 23/03/2032 | 5.73 | 120.05% | 54 |
| 02/11/2035 | 5.80 | 117.62% | (123) |
| 23/03/2037 | 5.58 | 126.37% | 494 |
Closing Date: February 15, 2024
Lebanese Forex Market
| Last Price | Previous | % Change | |
| $/LBP | 15,000 | 15,000 | – |
| €/LBP | 16,147.50 | 16,156.50 | -0.06% |
| £/LBP | 18,868.50 | 18,900.00 | -0.17% |
| NEER | 244.09 | 243.97 | 0.05% |
Closing Date: February 16, 2024