
Discover today’s performance of BLOM indices, the closing prices of Lebanese stocks and Eurobonds, as well as the exchange rate of major currencies against the LBP.
BLOM Stock Index (BSI) – today’s performance
| Last | Previous | % Change | Y-t-D Change | |
| BSI | 1,840.28 | 1,903.43 | -3.32% | -6.73% |
| High | 1,903.43 | 1,918.55 | ||
| Low | 1,810.23 | 1,862.94 | ||
| Volume | 33,152 | 25,057 | ||
| Val ($) | 2,661,123 | 1,685,130 |
I): BLOM preferred Shares Index (BPSI): today’s Performance
| Last | Previous | Change | |
| BPSI | 39.62 | 39.62 | 0.00% |
| Volume | |||
| Value |
Lebanese Stocks: today’s Trades and Closing Prices
| Last Price ($) | % Change | Volume | VWAP ($) | |
| Solidere A | 80.1 | -5.60% | 26,273 | 80.24 |
| Solidere B | 81.35 | -3.15% | 6,879 | 80.39 |
Closing Date: February 20, 2024
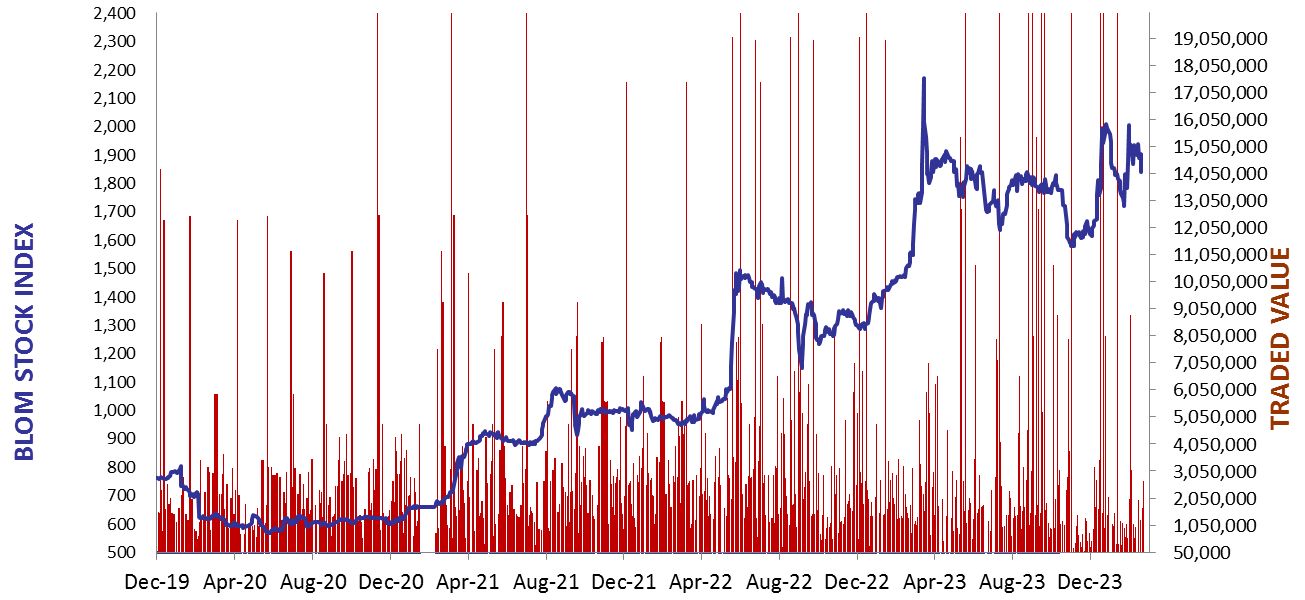
The BLOM Stock Index
BLOM BOND INDEX: Last Session’s Performance
| Last | Previous | Change | Y-t-D Change | ||
| BBI | 5.20 | 5.13 | 1.50% | -13.70% | |
| Weighted Yield | 210.35% | 210.20% | 16 | bps | |
| Duration (Years) | 1.15 | 1.14 | |||
| 5Y Bond Yield | 121.80% | 122.10% | -30 | bps | |
| 5Y Spread* | 11,682 | 11,712 | -30 | bps | |
| 10Y Bond Yield | 121.40% | 120.70% | 70 | bps | |
| 10Y Spread* | 11,697 | 11,627 | 70 | bps |
*spread between Lebanese Eurobonds and US Treasuries
| Price | Yield | Yield Change | |
| 26/02/2025 | 5.69 | 675.84% | 1,766 |
| 12/06/2025 | 5.95 | 427.93% | 80 |
| 28/11/2026 | 5.74 | 186.98% | (250) |
| 23/03/2027 | 5.84 | 172.58% | (335) |
| 29/11/2027 | 5.81 | 147.62% | (104) |
| 03/11/2028 | 5.65 | 131.73% | (36) |
| 26/02/2030 | 5.74 | 121.74% | (134) |
| 22/04/2031 | 5.69 | 121.17% | (67) |
| 23/03/2032 | 5.68 | 121.43% | 163 |
| 02/11/2035 | 5.84 | 116.83% | (405) |
| 23/03/2037 | 5.66 | 125.09% | (124) |
Closing Date: February 19, 2024
Lebanese Forex Market
| Last Price | Previous | % Change | |
| $/LBP | 15,000 | 15,000 | – |
| €/LBP | 16,168.50 | 16,165.50 | 0.02% |
| £/LBP | 18,894.00 | 18,889.50 | 0.02% |
| NEER | 239.07 | 238.95 | 0.05% |
Closing Date: February 20, 2024