
Discover today’s performance of BLOM indices, the closing prices of Lebanese stocks and Eurobonds, as well as the exchange rate of major currencies against the LBP.
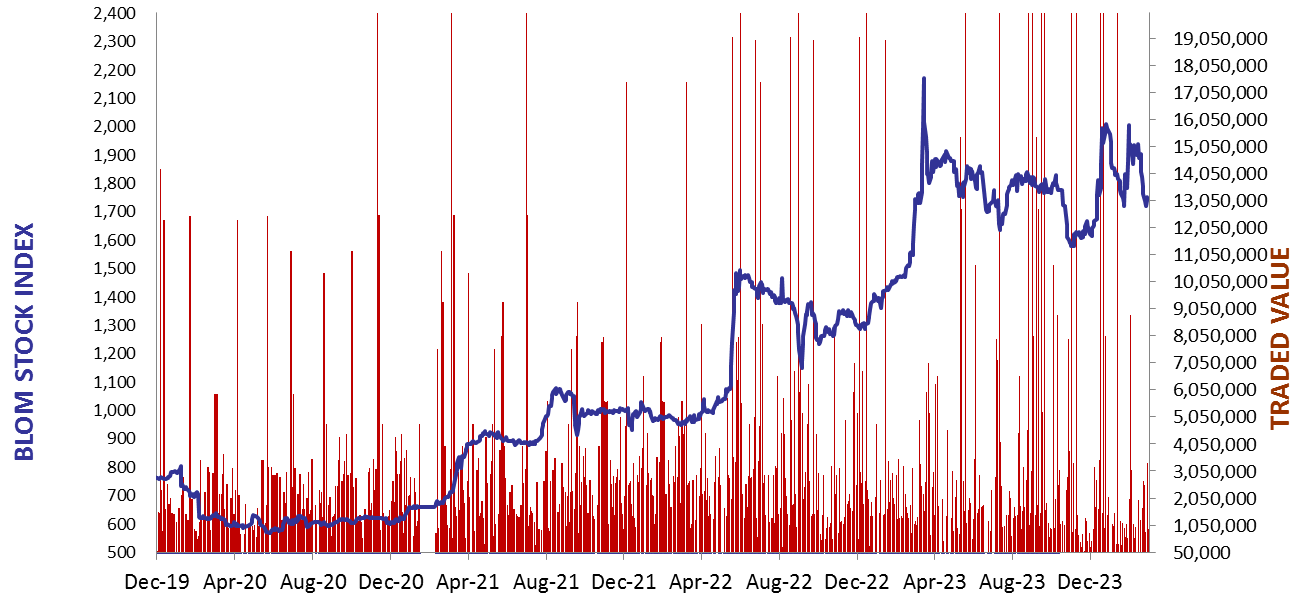
BLOM Stock Index (BSI) – today’s performance
| Last | Previous | % Change | Y-t-D Change | |
| BSI | 1,729.31 | 1,718.61 | 0.62% | -12.35% |
| High | 1,773.22 | 1,759.10 | ||
| Low | 1,710.78 | 1,718.61 | ||
| Volume | 18,785 | 21,741 | ||
| Val ($) | 672,184 | 145,229 |
I): BLOM preferred Shares Index (BPSI): today’s Performance
| Last | Previous | Change | |
| BPSI | 39.62 | 39.62 | 0.00% |
| Volume | |||
| Value |
Lebanese Stocks: today’s Trades and Closing Prices
| Last Price ($) | % Change | Volume | VWAP ($) | |
| Solidere A | 75.4 | -0.46% | 6,160 | 76.1 |
| Solidere B | 75 | 3.31% | 2,625 | 75.01 |
| Byblos Listed | 0.65 | -2.99% | 10,000 | 0.7 |
Closing Date: March 08, 2024
The BLOM Stock Index
BLOM BOND INDEX: Last Session’s Performance
| Last | Previous | Change | Y-t-D Change | ||
| BBI | 6.03 | 5.89 | 2.38% | 0.00% | |
| Weighted Yield | 197.22% | 200.17% | -295 | bps | |
| Duration (Years) | 1.31 | 1.30 | |||
| 5Y Bond Yield | 107.40% | 109.60% | -220 | bps | |
| 5Y Spread* | 10,247 | 10,465 | -218 | bps | |
| 10Y Bond Yield | 105.60% | 108.00% | -240 | bps | |
| 10Y Spread* | 10,132 | 10,368 | -236 | bps |
*spread between Lebanese Eurobonds and US Treasuries
| Price | Yield | Yield Change | |
| 26/02/2025 | 6.69 | 660.31% | (1,171) |
| 12/06/2025 | 6.83 | 415.39% | (292) |
| 28/11/2026 | 6.59 | 175.83% | (164) |
| 23/03/2027 | 6.65 | 163.13% | (209) |
| 29/11/2027 | 6.68 | 136.66% | (201) |
| 03/11/2028 | 6.69 | 118.44% | (230) |
| 26/02/2030 | 6.68 | 107.81% | (210) |
| 22/04/2031 | 6.69 | 105.78% | (256) |
| 23/03/2032 | 6.69 | 105.34% | (266) |
| 02/11/2035 | 6.68 | 103.14% | (240) |
| 23/03/2037 | 6.67 | 107.57% | (213) |
Closing Date: March 07, 2024
Lebanese Forex Market
| Last Price | Previous | % Change | |
| $/LBP | 15,000 | 15,000 | – |
| €/LBP | 16,417.50 | 16,419.00 | -0.01% |
| £/LBP | 19,206.00 | 19,209.00 | -0.02% |
| NEER | 240.67 | 240.61 | 0.02% |
Closing Date: March 08, 2024