
Discover today’s performance of BLOM indices, the closing prices of Lebanese stocks and Eurobonds, as well as the exchange rate of major currencies against the LBP.
BLOM Stock Index (BSI) – today’s performance
| Last | Previous | % Change | Y-t-D Change | |
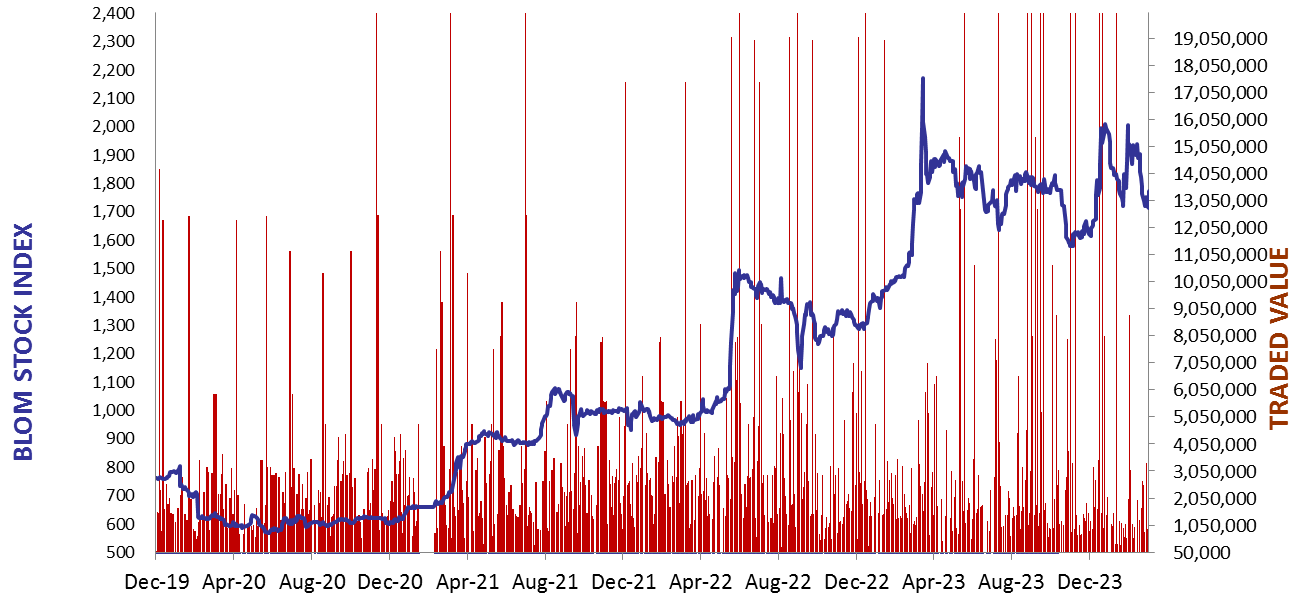
| BSI | 1,724.66 | 1,725.64 | -0.06% | -12.59% |
| High | 1,729.50 | 1,748.57 | ||
| Low | 1,721.50 | 1,710.00 | ||
| Volume | 6,916 | 3,015 | ||
| Val ($) | 502,024 | 220,277 |
I): BLOM preferred Shares Index (BPSI): today’s Performance
| Last | Previous | Change | |
| BPSI | 39.62 | 39.62 | 0.00% |
| Volume | |||
| Value |
Lebanese Stocks: today’s Trades and Closing Prices
| Last Price ($) | % Change | Volume | VWAP ($) | |
| Solidere A | 73.5 | -0.14% | 2,675 | 73.52 |
| Solidere B | 72 | 0.00% | 4,241 | 72 |
Closing Date: April 05, 2024
The BLOM Stock Index
BLOM BOND INDEX: Last Session’s Performance
| Last | Previous | Change | Y-t-D Change | ||
| BBI | 5.98 | 5.97 | 0.07% | -0.88% | |
| Weighted Yield | 210.32% | 209.88% | 44 | bps | |
| Duration (Years) | 1.38 | 1.38 | |||
| 5Y Bond Yield | 108.30% | 108.10% | 20 | bps | |
| 5Y Spread* | 10,330 | 10,307 | 23 | bps | |
| 10Y Bond Yield | 107.80% | 107.50% | 30 | bps | |
| 10Y Spread* | 10,334 | 10,302 | 32 | bps |
*spread between Lebanese Eurobonds and US Treasuries
| Price | Yield | Yield Change | |
| 26/02/2025 | 6.56 | 753.14% | 469 |
| 12/06/2025 | 6.74 | 457.78% | 122 |
| 28/11/2026 | 6.59 | 180.82% | 4 |
| 23/03/2027 | 6.65 | 167.02% | (58) |
| 29/11/2027 | 6.62 | 139.68% | (4) |
| 03/11/2028 | 6.58 | 121.59% | 21 |
| 26/02/2030 | 6.60 | 108.21% | 16 |
| 22/04/2031 | 6.59 | 108.51% | 32 |
| 23/03/2032 | 6.58 | 107.39% | 6 |
| 02/11/2035 | 6.58 | 105.62% | 39 |
| 23/03/2037 | 6.66 | 108.15% | (49) |
Closing Date: April 04, 2024
Lebanese Forex Market
| Last Price | Previous | % Change | |
| $/LBP | 15,000 | 15,000 | – |
| €/LBP | 16,260.00 | 16,252.50 | 0.05% |
| £/LBP | 18,942.00 | 18,960.00 | -0.09% |
| NEER | 241.22 | 241.11 | 0.05% |
Closing Date: April 05, 2024