
Discover today’s performance of BLOM indices, the closing prices of Lebanese stocks and Eurobonds, as well as the exchange rate of major currencies against the LBP.
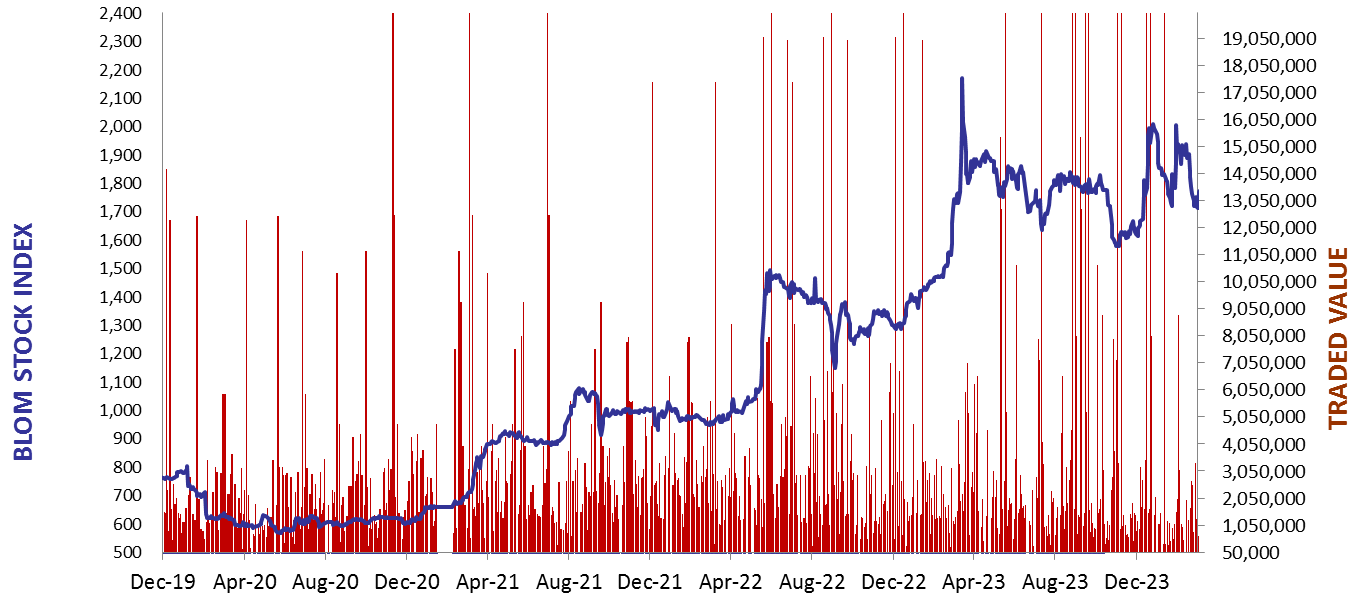
BLOM Stock Index (BSI) – today’s performance
| Last | Previous | % Change | Y-t-D Change | |
| BSI | 1,687.55 | 1,701.23 | -0.80% | -14.47% |
| High | 1,753.53 | 1,753.53 | ||
| Low | 1,687.55 | 1,692.30 | ||
| Volume | 21,175 | 7,385 | ||
| Val ($) | 782,714 | 549,346 |
I): BLOM preferred Shares Index (BPSI): today’s Performance
| Last | Previous | Change | |
| BPSI | 35.15 | 35.15 | 0.00% |
| Volume | |||
| Value |
Lebanese Stocks: today’s Trades and Closing Prices
| Last Price ($) | % Change | Volume | VWAP ($) | |
| Solidere A | 73.5 | -1.93% | 10,187 | 73.43 |
| Solidere B | 73.5 | -0.14% | 388 | 73.5 |
| Byblos Bank – Listed Shares | 0.58 | 3.57% | 10,600 | 0.6 |
Closing Date: April 17, 2024
The BLOM Stock Index
BLOM BOND INDEX: Last Session’s Performance
| Last | Previous | Change | Y-t-D Change | ||
| BBI | 5.79 | 5.87 | -1.50% | -4.05% | |
| Weighted Yield | 221.03% | 218.33% | 270 | bps | |
| Duration (Years) | 1.32 | 1.33 | |||
| 5Y Bond Yield | 111.40% | 109.90% | 150 | bps | |
| 5Y Spread* | 10,622 | 10,474 | 148 | bps | |
| 10Y Bond Yield | 110.40% | 108.10% | 230 | bps | |
| 10Y Spread* | 10,557 | 10,332 | 225 | bps |
*spread between Lebanese Eurobonds and US Treasuries
| Price | Yield | Yield Change | |
| 26/02/2025 | 6.38 | 814.96% | 1,211 |
| 12/06/2025 | 6.55 | 487.06% | 404 |
| 28/11/2026 | 6.29 | 188.41% | 235 |
| 23/03/2027 | 6.33 | 172.85% | 228 |
| 29/11/2027 | 6.49 | 142.75% | 71 |
| 03/11/2028 | 6.42 | 124.66% | 157 |
| 26/02/2030 | 6.44 | 110.16% | 48 |
| 22/04/2031 | 6.34 | 113.04% | 309 |
| 23/03/2032 | 6.41 | 109.39% | 190 |
| 02/11/2035 | 6.39 | 109.34% | 249 |
| 23/03/2037 | 6.47 | 110.65% | 128 |
Closing Date: April 16, 2024
Lebanese Forex Market
| Last Price | Previous | % Change | |
| $/LBP | 15,000 | 15,000 | – |
| €/LBP | 15,921.00 | 15,925.50 | -0.03% |
| £/LBP | 18,628.50 | 18,636.00 | -0.04% |
| NEER | 242.53 | 242.34 | 0.08% |
Closing Date: April 17, 2024