
Discover today’s performance of BLOM indices, the closing prices of Lebanese stocks and Eurobonds, as well as the exchange rate of major currencies against the LBP.
BLOM Stock Index (BSI) – today’s performance
| Last | Previous | % Change | Y-t-D Change | |
| BSI | 1,694.43 | 1,697.72 | -0.19% | -14.12% |
| High | 1,750.12 | 1,697.80 | ||
| Low | 1,694.43 | 1,680.60 | ||
| Volume | 24,985 | 17,662 | ||
| Val ($) | 1,752,115 | 1,310,710 |
I): BLOM preferred Shares Index (BPSI): today’s Performance
| Last | Previous | Change | |
| BPSI | 35.15 | 35.15 | 0.00% |
| Volume | |||
| Value |
Lebanese Stocks: today’s Trades and Closing Prices
| Last Price ($) | % Change | Volume | VWAP ($) | |
| Solidere A | 74.4 | 0.20% | 15,656 | 74.4 |
| Solidere B | 73.8 | -0.20% | 2,000 | 73.8 |
| HOLCIM | 60 | -3.23% | 7,329 | 60 |
Closing Date: April 19, 2024
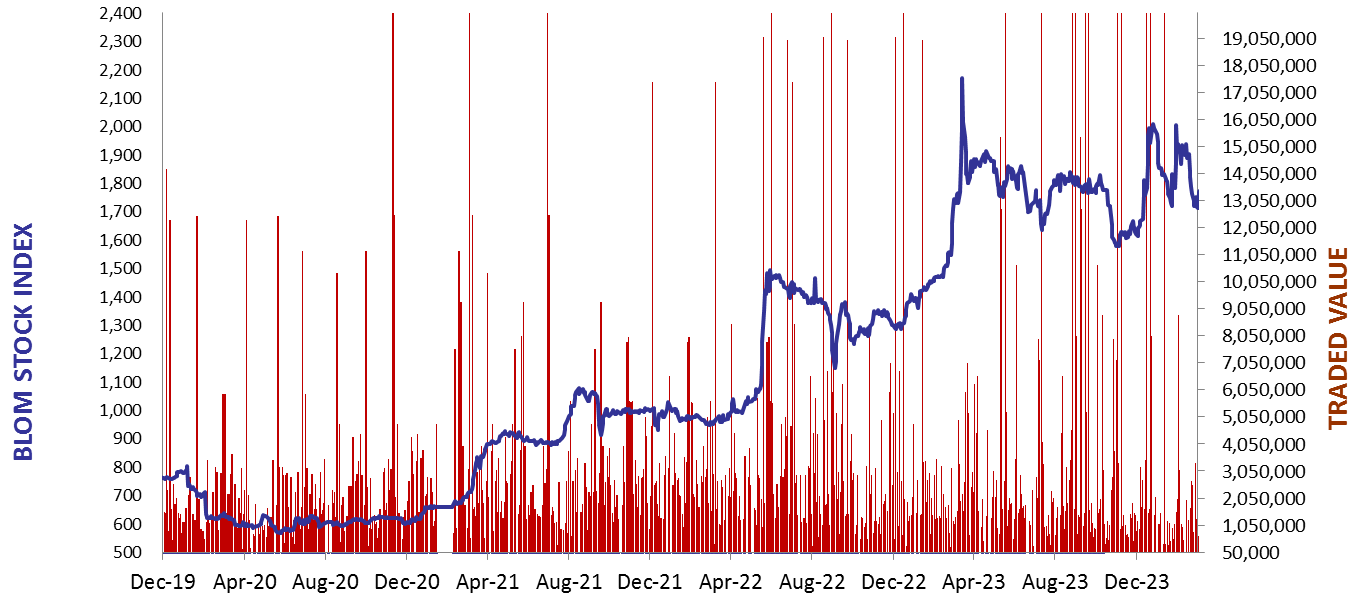
The BLOM Stock Index
BLOM BOND INDEX: Last Session’s Performance
| Last | Previous | Change | Y-t-D Change | ||
| BBI | 5.77 | 5.76 | 0.11% | -4.30% | |
| Weighted Yield | 222.37% | 222.11% | 25 | bps | |
| Duration (Years) | 1.31 | 1.31 | |||
| 5Y Bond Yield | 111.20% | 111.70% | -50 | bps | |
| 5Y Spread* | 10,602 | 10,654 | -52 | bps | |
| 10Y Bond Yield | 110.25% | 110.40% | -15 | bps | |
| 10Y Spread* | 10,542 | 10,563 | -21 | bps |
*spread between Lebanese Eurobonds and US Treasuries
| Price | Yield | Yield Change | |
| 26/02/2025 | 6.40 | 822.48% | 77 |
| 12/06/2025 | 6.53 | 491.96% | 263 |
| 28/11/2026 | 6.29 | 188.94% | 1 |
| 23/03/2027 | 6.31 | 173.33% | (12) |
| 29/11/2027 | 6.41 | 144.08% | 6 |
| 03/11/2028 | 6.38 | 125.30% | 9 |
| 26/02/2030 | 6.43 | 110.36% | (19) |
| 22/04/2031 | 6.39 | 112.46% | (10) |
| 23/03/2032 | 6.40 | 109.42% | (15) |
| 02/11/2035 | 6.40 | 109.18% | (5) |
| 23/03/2037 | 6.44 | 110.97% | 45 |
Closing Date: April 18, 2024
Lebanese Forex Market
| Last Price | Previous | % Change | |
| $/LBP | 15,000 | 15,000 | – |
| €/LBP | 15,946.50 | 15,964.50 | -0.11% |
| £/LBP | 18,618.00 | 18,652.50 | -0.18% |
| NEER | 242.63 | 242.33 | 0.12% |
Closing Date: April 19, 2024