Discover today’s performance of BLOM indices, the closing prices of Lebanese stocks and Eurobonds, as well as the exchange rate of major currencies against the LBP.
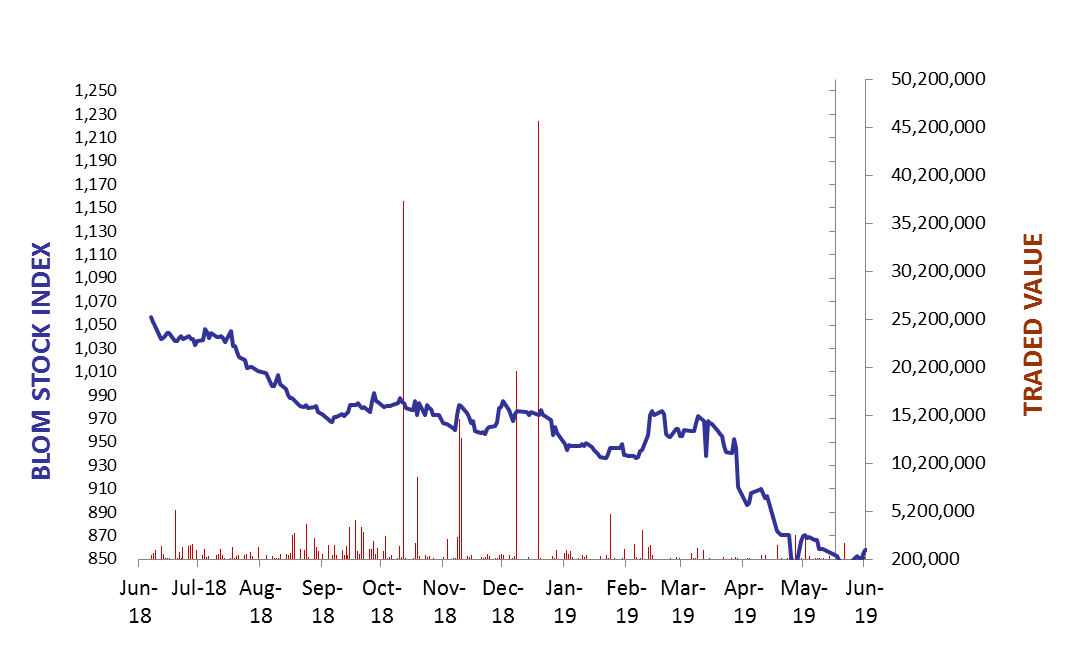
BLOM Stock Index (BSI) – today’s performance
| Last | Previous | % Change | Y-t-D Change | |
| BSI | 860.20 | 857.89 | 0.27% | -12.17% |
| High | 962.30 | 962.30 | ||
| Low | 857.40 | 857.40 | ` | |
| Volume | 21,059 | 68,995 | ||
| Val ($) | 135,511 | 422,753 |
I): BLOM preferred Shares Index (BPSI): today’s Performance
| Last | Previous | Change | |
| BPSI | 83.70 | 83.70 | 0.00% |
| Volume | – | – | |
| Value | – | – |
Lebanese Stocks: today’s Trades and Closing Prices
| Last Price ($) | % Change | Volume | VWAP ($) | |
| Solidere A | 6.3 | -3.37% | 11,840 | 6.42 |
| Solidere B | 6.52 | -0.15% | 7,427 | 6.51 |
| Bank Audi | 4 | 0.00% | 396 | 4.00 |
| Bank Audi GDR | 4 | 0.00% | 396 | 4.00 |
| BLOM – Listed Shares | 8 | 2.70% | 1,000 | 8.00 |
The BLOM Stock Index
Lebanese Global Depository Receipts: Last session’s Performance
| GDRs | Last Price ($) | Previous Price ($) | % Change | Volume | Value ($) |
| BLOM GDR | 7.3 | 7.35 | -0.68% | 48,364 | 77,924 |
| Audi GDR | 3.96 | 3.96 | 0.00% | 351,377 | |
| Byblos GDR | 77 | 77 | 0.00% | – | – |
Closing Date: 26 June 2019
Source: London Stock Exchange
BLOM BOND INDEX: Last Session’s Performance
| Last | Previous | Change | Y-t-D Change | ||
| BBI | 88.42 | 88.40 | 0.03% | -12.51% | |
| Weighted Yield | 11.26% | 11.25% | 1 | bps | |
| Duration (Years) | 5.14 | 5.15 | |||
| 5Y Bond Yield | 11.93% | 11.90% | 3 | bps | |
| 5Y Spread* | 1019 | 1023 | -4 | bps | |
| 10Y Bond Yield | 11.03% | 11.08% | -5 | bps | |
| 10Y Spread* | 922 | 922 | 0 | bps | |
*between Lebanese Eurobonds and US Treasuries
Closing Date: 26 June 2019
Lebanese Eurobonds: Last Sessions’ Prices and Yields
| Price | Yield | Yield Change | |
| 12/04/2021 | 93.54 | 12.35% | 0 |
| 04/10/2022 | 84.67 | 11.88% | 4 |
| 27/01/2023 | 83.04 | 11.95% | 2 |
| 22/04/2024 | 81.25 | 11.86% | 4 |
| 04/11/2024 | 79.25 | 11.55% | 4 |
| 03/12/2024 | 81.50 | 11.69% | 0 |
| 26/02/2025 | 78.58 | 11.43% | 3 |
| 12/06/2025 | 79.17 | 11.12% | 2 |
| 28/11/2026 | 77.88 | 11.04% | -1 |
| 23/03/2027 | 78.00 | 11.16% | -1 |
| 29/11/2027 | 76.92 | 11.02% | -3 |
| 03/11/2028 | 76.83 | 10.61% | -4 |
| 26/02/2030 | 75.83 | 10.46% | -3 |
| 22/04/2031 | 75.60 | 10.68% | -5 |
| 23/03/2032 | 77.17 | 10.25% | 1 |
| 02/11/2035 | 75.00 | 10.23% | 1 |
| 23/03/2037 | 75.92 | 10.23% | -4 |
Lebanese Forex Market
| Last Price | Previous | % Change | Y-t-D | |
| $/LBP | 1,514.25 | 1,514.25 | – | |
| €/LBP | 1,714.03 | 1,713.73 | 0.02% | |
| £/LBP | 1,916.18 | 1,912.72 | 0.18% | |
| NEER | 117.91 | 117.98 | -0.06% |
Closing Date: 27 June 2019