Discover today’s performance of BLOM indices, the closing prices of Lebanese stocks and Eurobonds, as well as the exchange rate of major currencies against the LBP.
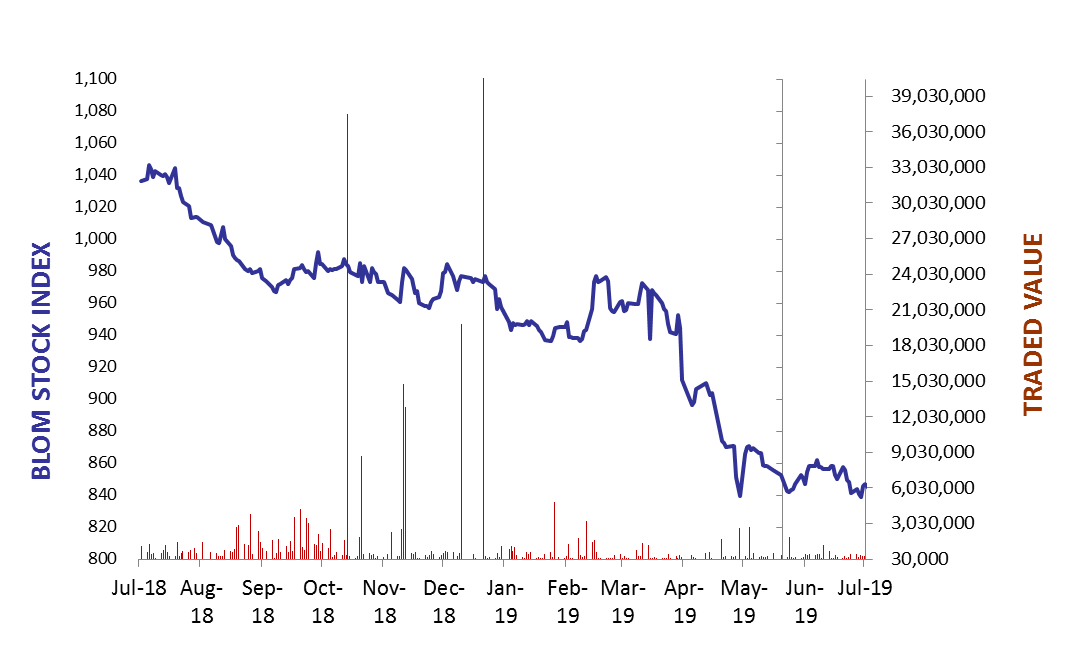
BLOM Stock Index (BSI) – today’s performance
| Last | Previous | % Change | Y-t-D Change | |
| BSI | 842.55 | 846.90 | -0.51% | -13.74% |
| High | 846.90 | 846.90 | ||
| Low | 839.90 | 839.90 | ` | |
| Volume | 67,248 | 53,234 | ||
| Val ($) | 426,048 | 339,677 |
I): BLOM preferred Shares Index (BPSI): today’s Performance
| Last | Previous | Change | |
| BPSI | 82.43 | 82.34 | 0.11% |
| Volume | 460 | 100 | |
| Value | 34,500 | 6,500 |
Lebanese Stocks: today’s Trades and Closing Prices
| Last Price ($) | % Change | Volume | VWAP ($) | |
| Solidere A | 6.38 | -2.60% | 47,071 | 6.22 |
| Solidere B | 6.23 | -4.01% | 10,000 | 6.19 |
| Bank Audi | 3.85 | -0.26% | 717 | 3.85 |
| Bank Audi GDR | 3.81 | -1.30% | 9,000 | 3.78 |
| Bank Audi Pref H | 75 | 2.74% | 460 | 75.00 |
The BLOM Stock Index
Lebanese Global Depository Receipts: Last session’s Performance
| GDRs | Last Price ($) | Previous Price ($) | % Change | Volume | Value ($) |
| BLOM GDR | 7.4 | 7.4 | 0.00% | 42,500 | 314,500 |
| Audi GDR | 3.96 | 3.96 | 0.00% | – | – |
| Byblos GDR | 77 | 77 | 0.00% | – | – |
Closing Date: 19 July 2019
Source: London Stock Exchange
BLOM BOND INDEX: Last Session’s Performance
| Last | Previous | Change | Y-t-D Change | ||
| BBI | 89.54 | 89.51 | 0.04% | -11.40% | |
| Weighted Yield | 11.03% | 11.04% | 0 | bps | |
| Duration (Years) | 5.10 | 5.10 | |||
| 5Y Bond Yield | 11.68% | 11.58% | 10 | bps | |
| 5Y Spread* | 991 | 984 | 7 | bps | |
| 10Y Bond Yield | 10.80% | 10.77% | 3 | bps | |
| 10Y Spread* | 889 | 888 | 1 | bps | |
*between Lebanese Eurobonds and US Treasuries
Closing Date: 19 July 2019
Lebanese Eurobonds: Last Sessions’ Prices and Yields
| Price | Yield | Yield Change | |
| 12/04/2021 | 93.93 | 12.23% | 1 |
| 04/10/2022 | 85.63 | 11.58% | 0 |
| 27/01/2023 | 83.96 | 11.68% | 4 |
| 22/04/2024 | 82.33 | 11.58% | 0 |
| 04/11/2024 | 79.94 | 11.40% | 0 |
| 03/12/2024 | 81.91 | 11.61% | 3 |
| 26/02/2025 | 79.88 | 11.12% | 0 |
| 12/06/2025 | 80.42 | 10.83% | -1 |
| 28/11/2026 | 78.96 | 10.82% | -1 |
| 23/03/2027 | 79.21 | 10.91% | -1 |
| 29/11/2027 | 78.17 | 10.77% | 0 |
| 03/11/2028 | 78.46 | 10.31% | -1 |
| 26/02/2030 | 76.79 | 10.30% | -2 |
| 22/04/2031 | 77.38 | 10.37% | 0 |
| 23/03/2032 | 78.33 | 10.06% | -1 |
| 02/11/2035 | 76.33 | 10.03% | -2 |
| 23/03/2037 | 77.08 | 10.06% | -2 |
Lebanese Forex Market
| Last Price | Previous | % Change | Y-t-D | |
| $/LBP | 1,514.25 | 1,514.25 | – | |
| €/LBP | 1,691.11 | 1,691.57 | -0.03% | |
| £/LBP | 1,879.25 | 1,884.68 | -0.29% | |
| NEER | 118.33 | 118.19 | 0.12% |
Closing Date: 22 July 2019