Discover today’s performance of BLOM indices, the closing prices of Lebanese stocks and Eurobonds, as well as the exchange rate of major currencies against the LBP.
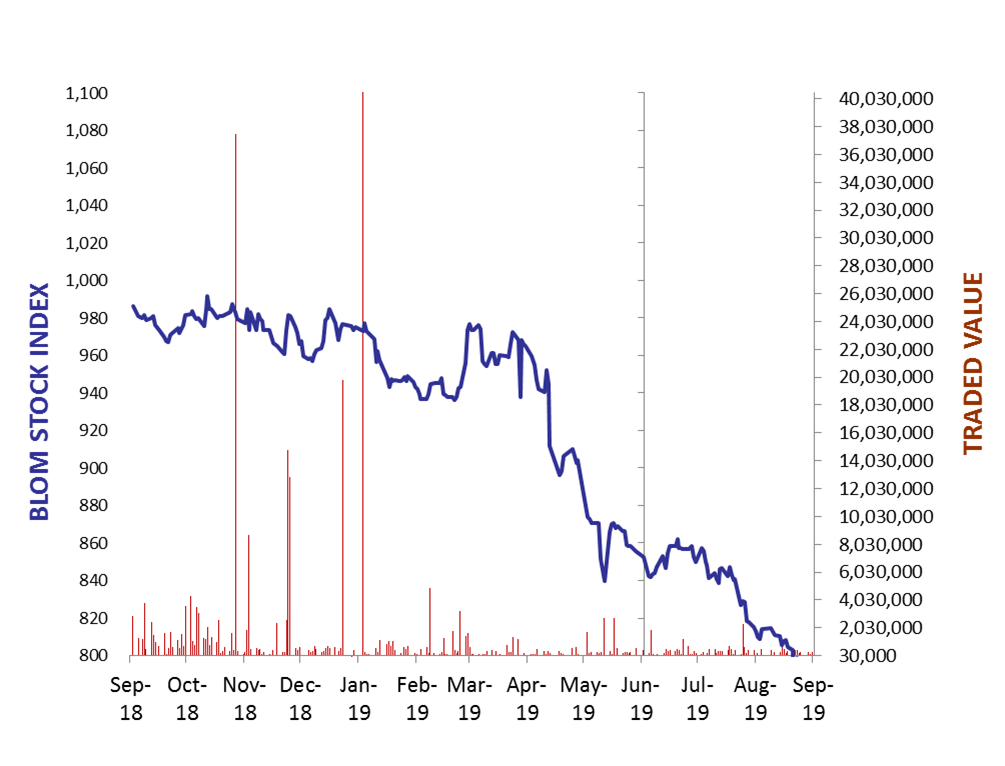
BLOM Stock Index (BSI) – today’s performance
| Last | Previous | % Change | Y-t-D Change | |
| BSI | 794.99 | 797.89 | -0.36% | -18.61% |
| High | 795.00 | 798.20 | ||
| Low | 794.20 | 797.20 | ` | |
| Volume | 31,311 | 83,765 | ||
| Val ($) | 197,569 | 424,897 |
I): BLOM preferred Shares Index (BPSI): today’s Performance
| Last | Previous | Change | |
| BPSI | 80.07 | 80.07 | 0.00% |
| Volume | – | – | |
| Value | – | – |
Lebanese Stocks: today’s Trades and Closing Prices
| Last Price ($) | % Change | Volume | VWAP ($) | |
| Solidere A | 5.88 | -4.39% | 17,626 | 5.9 |
| Solidere B | 5.87 | -1.68% | 3,090 | 5.87 |
| Bank Audi | 3.65 | 0.27% | 553 | 3.65 |
| BLOM – Listed Shares | 7.3 | 0.27% | 10,000 | 7.30 |
| HOLCIM | 9.5 | -1.66% | 42 | 9.50 |
The BLOM Stock Index
Lebanese Global Depository Receipts: Last session’s Performance
| GDRs | Last Price ($) | Previous Price ($) | % Change | Volume | Value ($) |
| BLOM GDR | 6.90 | 6.95 | -0.72% | 6,096 | 42,112 |
| Audi GDR | 3.62 | 3.7 | -2.16% | 115,318 | 443,075 |
| Byblos GDR | 77 | 77 | 0.00% | – | – |
Closing Date: 10 Sept. 2019
Source: London Stock Exchange
BLOM BOND INDEX: Last Session’s Performance
| Last | Previous | Change | Y-t-D Change | ||
| BBI | 76.43 | 76.91 | -0.63% | -24.37% | |
| Weighted Yield | 15.03% | 14.85% | 18 | bps | |
| Duration (Years) | 4.80 | 4.82 | |||
| 5Y Bond Yield | 17.14% | 16.93% | 21 | bps | |
| 5Y Spread* | 1,562 | 1,547 | 15 | bps | |
| 10Y Bond Yield | 13.85% | 13.70% | 15 | bps | |
| 10Y Spread* | 1,228 | 1,220 | 8 | bps | |
*between Lebanese Eurobonds and US Treasuries
Closing Date: 09 Sept. 2019
Lebanese Eurobonds: Last Sessions’ Prices and Yields
| Price | Yield | Yield Change | |
| 12/04/2021 | 85.00 | 19.65% | 51 |
| 04/10/2022 | 74.42 | 17.16% | 19 |
| 27/01/2023 | 72.46 | 17.03% | 17 |
| 22/04/2024 | 69.92 | 16.13% | 3 |
| 04/11/2024 | 68.67 | 15.24% | 0 |
| 03/12/2024 | 69.63 | 15.72% | 15 |
| 26/02/2025 | 68.67 | 14.75% | 21 |
| 12/06/2025 | 69.00 | 14.33% | -3 |
| 28/11/2026 | 66.17 | 14.25% | 12 |
| 23/03/2027 | 65.92 | 14.41% | 16 |
| 29/11/2027 | 65.67 | 13.87% | 16 |
| 03/11/2028 | 66.04 | 13.13% | 15 |
| 26/02/2030 | 65.92 | 12.60% | 15 |
| 22/04/2031 | 65.78 | 12.71% | 20 |
| 23/03/2032 | 66.50 | 12.31% | 19 |
| 02/11/2035 | 66.50 | 11.71% | 0 |
| 23/03/2037 | 66.58 | 11.80% | 16 |
Lebanese Forex Market
| Last Price | Previous | % Change | Y-t-D | |
| $/LBP | 1,514.25 | 1,514.25 | – | |
| €/LBP | 1,659.00 | 1,665.03 | -0.36% | |
| £/LBP | 1,862.21 | 1,862.97 | -0.04% | |
| NEER | 120.08 | 119.92 | 0.13% |
Closing Date: 11 Sept. 2019