Lebanon’s trade deficit widened in the first 7 months of the year to reach $10.24B, up by 0.98% compared to the same period in 2018. Regardless of the promising progress in exports, which grew by a yearly 19.20% to $2.09B, the wider deficit came as a result of a 3.67% yearly increase in the value of imports to $12.33B noting that “ Mineral products “ and “Vegetable products” are the only 2 categories to witness an increase in its imported value .
In term of value, “Mineral products” were the leading imports to Lebanon by June 2019, grasping a 34.59% stake of total imported goods. “Products of the chemical or allied industries” followed, constituting 10.11% of the total, while “machinery and electrical instruments” grasped 8.87% of the total.
In details, Lebanon imported $4.27B worth of “Mineral Products”, compared to a value of 2.59B in the same period last year. In fact, the net weight of imported “mineral fuels, oils and their products” is still increasing since the start of the year and witnessed a yearly rise from 4,034,926 tons by July 2018 to reach 7,634,537 tons by July 2019.
Meanwhile, the value of “chemical or allied industries” recorded a decrease of 6.28% y-o-y to settle at $1.25B and that of “machinery and electrical instruments” also declined by 12.20% over the same period to $1.09B
In terms of top trade partners, Lebanon primarily imported from US, China, and Russia with shares of 9.33%, 8.46% and 7.70%, respectively, by July 2019.
As for exports, the top category of products exported from Lebanon were “pearls, precious stones and metals”, which grasped a share of 34.91% of total exports, followed by a share of 10.81% for “prepared foodstuffs, beverage, and tobacco” and 10.40% for “Products of the chemical or allied industries “over the same period.
In details, the value of “pearls, precious stones, & metals” surged from 428.30M by July 2018 to reach $731.41M by July 2019. As for the value of “Prepared foodstuffs; beverages, tobacco”, it declined by 5.60% y-o-y to $226.50M. Meanwhile, the value of “Products of the chemical or allied industries” recorded an increase of 8.39% year-on-year to $217.87M.
In the first 7months of 2019, Switzerland followed by the UAE and Saudi Arabia were Lebanon’s top three export destinations, respectively constituting 22.55%, 12.21%, and 6.64% of total exports.
Yearly Evolution of the Trade Deficit
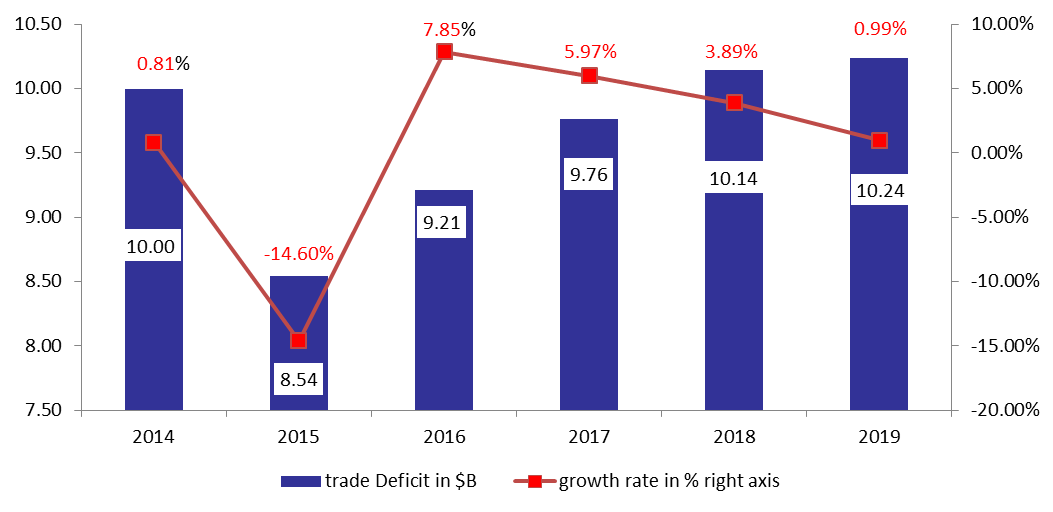
Source :Lebanese Customs