Discover today’s performance of BLOM indices, the closing prices of Lebanese stocks and Eurobonds, as well as the exchange rate of major currencies against the LBP.
BLOM Stock Index (BSI) – today’s performance
| Last | Previous | % Change | Y-t-D Change | |
| BSI | 608.56 | 617.17 | -1.39% | -22.53% |
| High | 617.17 | 620.20 | ||
| Low | 604.96 | 616.02 | ||
| Volume | 259,944 | 146,753 | ||
| Val ($) | 1,481,534 | 2,066,560 |
I): BLOM preferred Shares Index (BPSI): today’s Performance
| Last | Previous | Change | |
| BPSI | 60.02 | 60.02 | 0.00% |
| Volume | |||
| Value |
Lebanese Stocks: today’s Trades and Closing Prices
| Last Price ($) | % Change | Volume | VWAP ($) | |
| Solidere A | 14.28 | -2.19% | 79,382 | 14.24 |
| Solidere B | 14.09 | -4.41% | 13,497 | 14.29 |
| Audi Listed | 0.96 | 0.00% | 132,680 | 1 |
| Byblos Listed | 0.37 | -7.50% | 30,000 | 0.4 |
| CB (N) | 4.56 | 7.80% | 4,385 | 4.6 |
Closing Date: July 22 2020
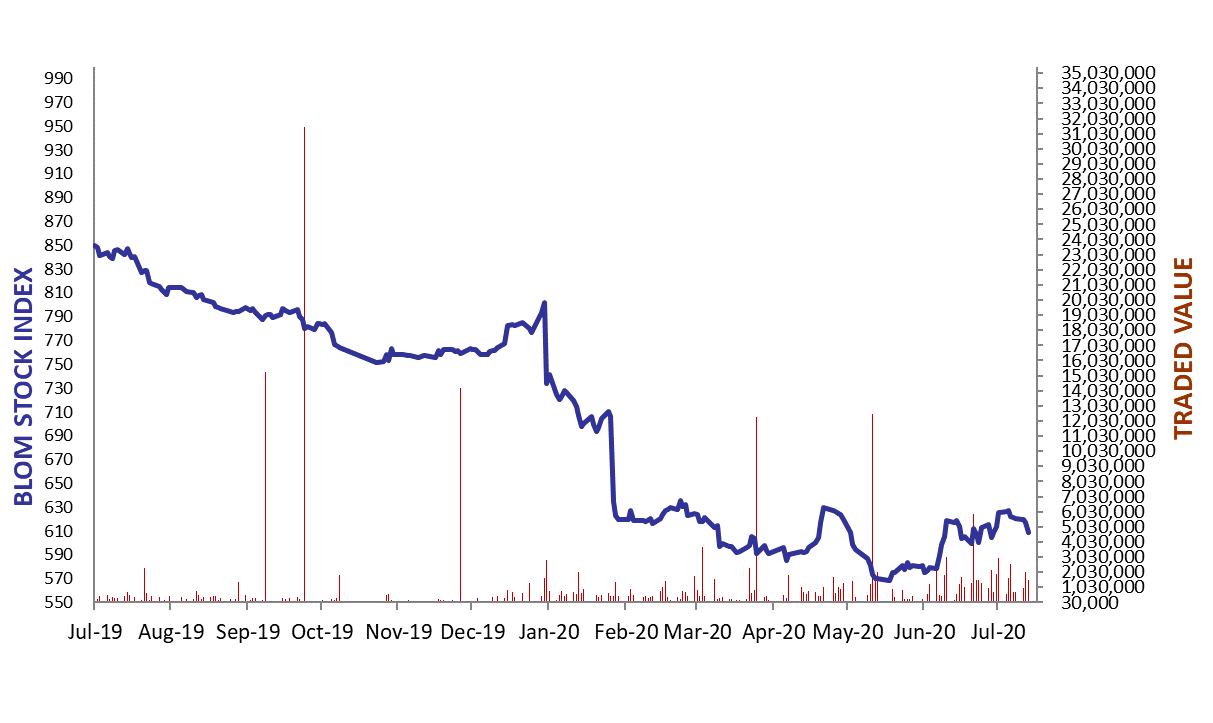
The BLOM Stock Index
Lebanese Global Depository Receipts: Last Session’s Performance
| Global Depository Receipts (GDRs) | Last Price ($) | Previous Price ($) | % Change | Volume | Value ($) |
| BLOM GDR | 1.30 | 1.30 | 0.00% | ||
| Audi GDR | 0.41 | 0.41 | 0.00% | 5,000,000 | 2,050,000 |
| Byblos GDR | 70 | 70 | 0.00% | – | – |
Closing Date: July 17, 2020
Source: London Stock Exchange
BLOM BOND INDEX: Last Session’s Performance
| Last | Previous | Change | Y-t-D Change | ||
| BBI | 15.68 | 15.99 | -1.98% | -68.99% | |
| Weighted Yield | 64.58% | 63.66% | 91 | bps | |
| Duration (Years) | 2.66 | 2.70 | |||
| 5Y Bond Yield | 111.00% | 111.00% | 0 | bps | |
| 5Y Spread* | 11,086 | 11,084 | 2 | bps | |
| 10Y Bond Yield | 50.90% | 50.30% | 60 | bps | |
| 10Y Spread* | 5,063 | 5,001 | 62 | bps | |
*spread between Lebanese Eurobonds and US Treasuries
Closing Date: July 21, 2020
Lebanese Eurobonds: Last Sessions’ Prices and Yields
| Price | Yield | Yield Change | |
| 10/4/2022 | 17.54 | 116.84% | 114 |
| 1/27/2023 | 16.96 | 105.03% | 118 |
| 4/22/2024 | 16.69 | 76.19% | 80 |
| 11/4/2024 | 16.71 | 67.35% | 48 |
| 12/3/2024 | 16.33 | 70.33% | 63 |
| 2/26/2025 | 16.47 | 64.48% | 66 |
| 6/12/2025 | 17.09 | 60.33% | 90 |
| 11/28/2026 | 16.34 | 54.02% | 66 |
| 3/23/2027 | 16.38 | 53.56% | 60 |
| 11/29/2027 | 16.33 | 50.76% | 57 |
| 11/3/2028 | 16.08 | 48.28% | 147 |
| 2/26/2030 | 16.00 | 46.02% | 192 |
| 4/22/2031 | 15.58 | 47.33% | 64 |
| 3/23/2032 | 16.25 | 44.91% | 59 |
| 11/2/2035 | 16.63 | 42.77% | 59 |
| 3/23/2037 | 16.75 | 43.38% | 91 |
Lebanese Forex Market
| Last Price | Previous | % Change | Y-t-D | |
| $/LBP | 1,514.25 | 1,514.25 | – | |
| €/LBP | 1,744.18 | 1,737.54 | 0.38% | |
| £/LBP | 1,910.76 | 1,918.75 | -0.42% | |
| NEER | 127.67 | 128.11 | -0.35% |
Closing Date: July 22, 2020