
Discover today’s performance of BLOM indices, the closing prices of Lebanese stocks and Eurobonds, as well as the exchange rate of major currencies against the LBP.
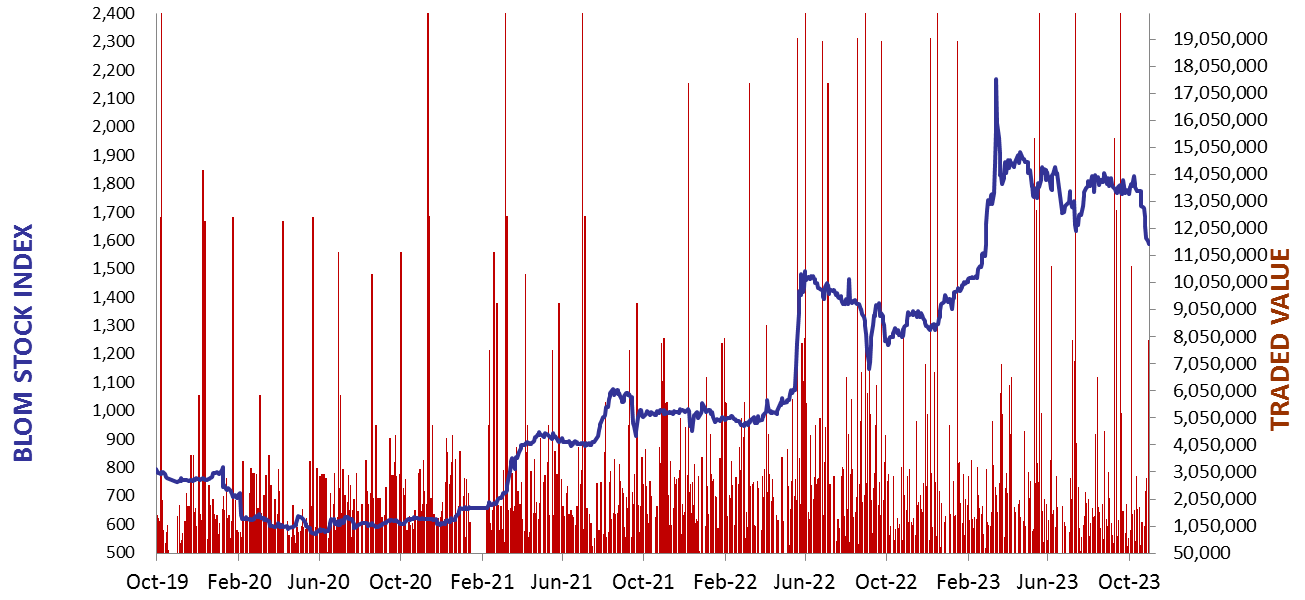
BLOM Stock Index (BSI) – today’s performance
| Last | Previous | % Change | Y-t-D Change | |
| BSI | 1,588.64 | 1,588.64 | 0.00% | 14.79% |
| High | 1,588.64 | 1,601.34 | ||
| Low | 1,588.64 | 1,582.46 | ||
| Volume | 0 | 441,372 | ||
| Val ($) | 0 | 29,687,237 |
I): BLOM preferred Shares Index (BPSI): today’s Performance
| Last | Previous | Change | |
| BPSI | 39.62 | 39.62 | 0.00% |
| Volume | |||
| Value |
Lebanese Stocks: today’s Trades and Closing Prices
Closing Date: November 1, 2023
The BLOM Stock Index
| Last | Previous | Change | Y-t-D Change | ||
| BBI | 6.04 | 6.30 | -4.13% | 0.16% | |
| Weighted Yield | 200.92% | 195.00% | 592 | bps | |
| Duration (Years) | 1.26 | 1.30 | |||
| 5Y Bond Yield | 154.50% | 151.45% | 305 | bps | |
| 5Y Spread* | 14,906 | 14,604 | 302 | bps | |
| 10Y Bond Yield | 112.10% | 107.50% | 460 | bps | |
| 10Y Spread* | 10,720 | 10,263 | 457 | bps |
BLOM BOND INDEX: Last Session’s Performance
| Price | Yield | Yield Change | |
| 04/11/2024 | 6.27 | 650.19% | 1,832 |
| 03/12/2024 | 6.16 | 565.88% | 1,971 |
| 26/02/2025 | 6.21 | 414.98% | 1,142 |
| 12/06/2025 | 6.49 | 310.68% | 622 |
| 28/11/2026 | 6.13 | 166.77% | 527 |
| 23/03/2027 | 6.24 | 154.58% | 307 |
| 29/11/2027 | 6.20 | 136.38% | 388 |
| 03/11/2028 | 6.21 | 122.50% | 429 |
| 26/02/2030 | 6.24 | 110.14% | 368 |
| 22/04/2031 | 6.20 | 114.29% | 403 |
| 23/03/2032 | 6.19 | 111.91% | 433 |
| 02/11/2035 | 6.19 | 113.80% | 554 |
| 23/03/2037 | 6.16 | 115.29% | 421 |
*spread between Lebanese Eurobonds and US Treasuries
Closing Date: October 31, 2023
Lebanese Forex Market
| Last Price | Previous | % Change | |
| $/LBP | 15,000 | 15,000 | – |
| €/LBP | 15,820.50 | 15,862.50 | -0.26% |
| £/LBP | 18,207.00 | 18,229.50 | -0.12% |
| NEER | 240.05 | 239.76 | 0.12% |
Closing Date: November 1, 2023