
Discover today’s performance of BLOM indices, the closing prices of Lebanese stocks and Eurobonds, as well as the exchange rate of major currencies against the LBP.
BLOM Stock Index (BSI) – today’s performance
| Last | Previous | % Change | Y-t-D Change | |
| BSI | 1,991.53 | 1,943.13 | 2.49% | 43.91% |
| High | 1,994.34 | 1,992.72 | ||
| Low | 1,942.38 | 1,899.69 | ||
| Volume | 15,938 | 92,734 | ||
| Val ($) | 1,413,761 | 8,030,144 |
I): BLOM preferred Shares Index (BPSI): today’s Performance
| Last | Previous | Change | |
| BPSI | 39.62 | 39.62 | 0.00% |
| Volume | |||
| Value |
Lebanese Stocks: today’s Trades and Closing Prices
| Last Price ($) | % Change | Volume | VWAP ($) | |
| Solidere A | 88.2 | 2.44% | 7,200 | 88.41 |
| Solidere B | 90.75 | 5.10% | 8,738 | 88.95 |
Closing Date: December 26, 2023
The BLOM Stock Index
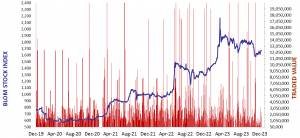
BLOM BOND INDEX: Last Session’s Performance
| Last | Previous | Change | Y-t-D Change | ||
| BBI | 5.84 | 5.84 | 0.15% | -3.09% | |
| Weighted Yield | 228.32% | 227.98% | 34 | bps | |
| Duration (Years) | 1.34 | 1.34 | |||
| 5Y Bond Yield | 161.80% | 162.00% | -20 | bps | |
| 5Y Spread* | 15,698 | 15,716 | -18 | bps | |
| 10Y Bond Yield | 113.95% | 114.10% | -15 | bps | |
| 10Y Spread* | 10,991 | 11,004 | -13 | bps |
*spread between Lebanese Eurobonds and US Treasuries
| Price | Yield | Yield Change | |
| 04/11/2024 | 5.99 | 842.86% | 192 |
| 03/12/2024 | 6.00 | 741.95% | 480 |
| 26/02/2025 | 5.98 | 498.15% | 69 |
| 12/06/2025 | 6.13 | 369.46% | 343 |
| 28/11/2026 | 5.98 | 176.60% | (21) |
| 23/03/2027 | 6.00 | 161.88% | (11) |
| 29/11/2027 | 6.05 | 142.03% | (65) |
| 03/11/2028 | 5.99 | 125.34% | (13) |
| 26/02/2030 | 6.05 | 113.52% | (36) |
| 22/04/2031 | 6.00 | 115.65% | (12) |
| 23/03/2032 | 6.01 | 113.81% | (16) |
| 02/11/2035 | 6.00 | 114.59% | (13) |
| 23/03/2037 | 6.00 | 116.81% | 20 |
Closing Date: December 22, 2023
Lebanese Forex Market
| Last Price | Previous | % Change | |
| $/LBP | 15,000 | 15,000 | – |
| €/LBP | 16,503.00 | 16,510.50 | -0.05% |
| £/LBP | 19,027.50 | 19,033.50 | -0.03% |
| NEER | 240.91 | 240.71 | 0.08% |
Closing Date: December 26, 2023