
Discover today’s performance of BLOM indices, the closing prices of Lebanese stocks and Eurobonds, as well as the exchange rate of major currencies against the LBP.
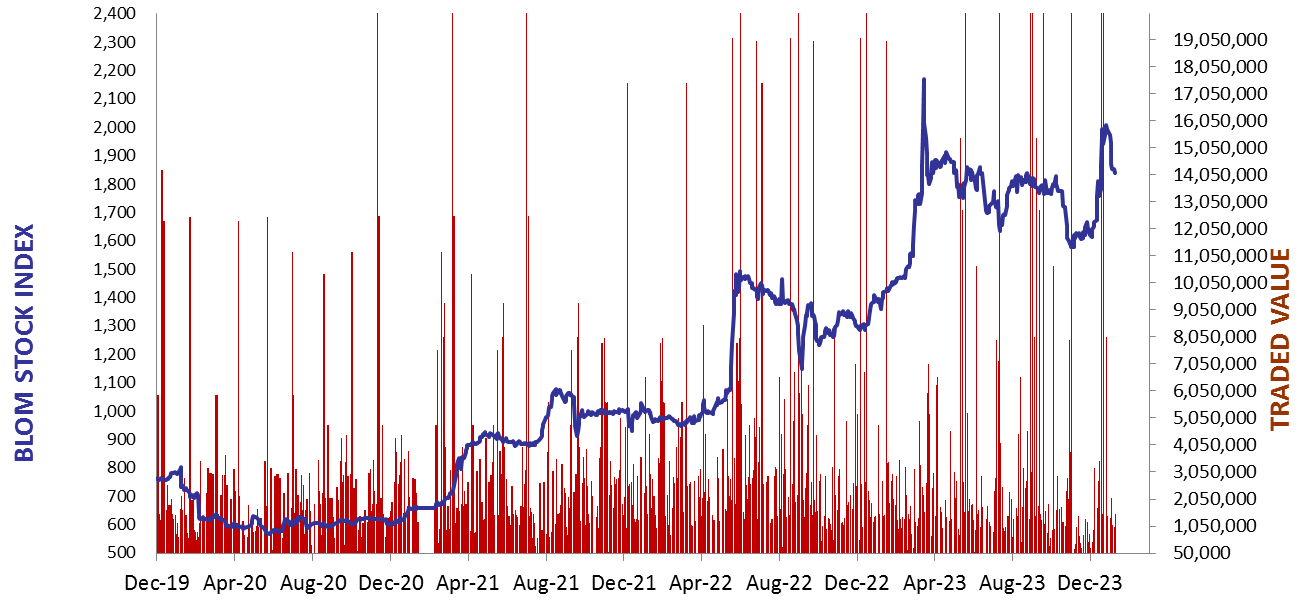
BLOM Stock Index (BSI) – today’s performance
| Last | Previous | % Change | Y-t-D Change | |
| BSI | 1,809.09 | 1,809.64 | -0.03% | -8.31% |
| High | 1,812.01 | 1,815.25 | ||
| Low | 1,804.76 | 1,807.42 | ||
| Volume | 20,017 | 3,700 | ||
| Val ($) | 284,523 | 295,950 |
I): BLOM preferred Shares Index (BPSI): today’s Performance
| Last | Previous | Change | |
| BPSI | 39.62 | 39.62 | 0.00% |
| Volume | |||
| Value |
Lebanese Stocks: today’s Trades and Closing Prices
| Last Price ($) | % Change | Volume | VWAP ($) | |
| Solidere A | 79.2 | -1.00% | 2,917 | 79.22 |
| Solidere B | 80 | 0.13% | 500 | 80 |
| Byblos | 0.81 | 17.39% | 16,600 | 0.8 |
Closing Date: January 17, 2024
The BLOM Stock Index
BLOM BOND INDEX: Last Session’s Performance
| Last | Previous | Change | Y-t-D Change | ||
| BBI | 5.34 | 5.34 | 0.04% | -11.41% | |
| Weighted Yield | 193.44% | 193.15% | 29 | bps | |
| Duration (Years) | 1.28 | 1.29 | |||
| 5Y Bond Yield | 116.85% | 116.80% | 5 | bps | |
| 5Y Spread* | 11,215 | 11,215 | 0 | bps | |
| 10Y Bond Yield | 115.70% | 115.80% | -10 | bps | |
| 10Y Spread* | 11,168 | 11,188 | -20 | bps |
*spread between Lebanese Eurobonds and US Treasuries
| Price | Yield | Yield Change | |
| 26/02/2025 | 5.87 | 556.27% | 285 |
| 12/06/2025 | 6.06 | 390.54% | 85 |
| 28/11/2026 | 5.88 | 180.30% | 8 |
| 23/03/2027 | 5.90 | 166.29% | 12 |
| 29/11/2027 | 5.93 | 144.34% | 3 |
| 03/11/2028 | 5.86 | 127.53% | 2 |
| 26/02/2030 | 5.89 | 116.89% | 2 |
| 22/04/2031 | 5.91 | 116.89% | (49) |
| 23/03/2032 | 5.90 | 115.89% | (7) |
| 02/11/2035 | 5.91 | 115.68% | (11) |
| 23/03/2037 | 5.95 | 118.00% | (11) |
Closing Date: January 16, 2024
Lebanese Forex Market
| Last Price | Previous | % Change | |
| $/LBP | 15,000 | 15,000 | – |
| €/LBP | 16,299.00 | 16,311.00 | -0.07% |
| £/LBP | 18,951.00 | 18,954.00 | -0.02% |
| NEER | 242.49 | 242.31 | 0.07% |
Closing Date: January 17, 2024