
Discover today’s performance of BLOM indices, the closing prices of Lebanese stocks and Eurobonds, as well as the exchange rate of major currencies against the LBP.
BLOM Stock Index (BSI) – today’s performance
| Last | Previous | % Change | Y-t-D Change | |
| BSI | 1,938.38 | 1,924.67 | 0.71% | -1.75% |
| High | 1,959.89 | 2,003.46 | ||
| Low | 1,916.86 | 1,847.35 | ||
| Volume | 85,365 | 29,534 | ||
| Val ($) | 3,087,379 | 2,535,547 |
I): BLOM preferred Shares Index (BPSI): today’s Performance
| Last | Previous | Change | |
| BPSI | 39.62 | 39.62 | 0.00% |
| Volume | |||
| Value |
Lebanese Stocks: today’s Trades and Closing Prices
| Last Price ($) | % Change | Volume | VWAP ($) | |
| Solidere A | 85.8 | 1.18% | 24,545 | 85.57 |
| Solidere B | 88.05 | 0.51% | 10,820 | 87.76 |
| Byblos shares | 0.75 | 2.74% | 50,000 | 0.8 |
Closing Date: February 02, 2024
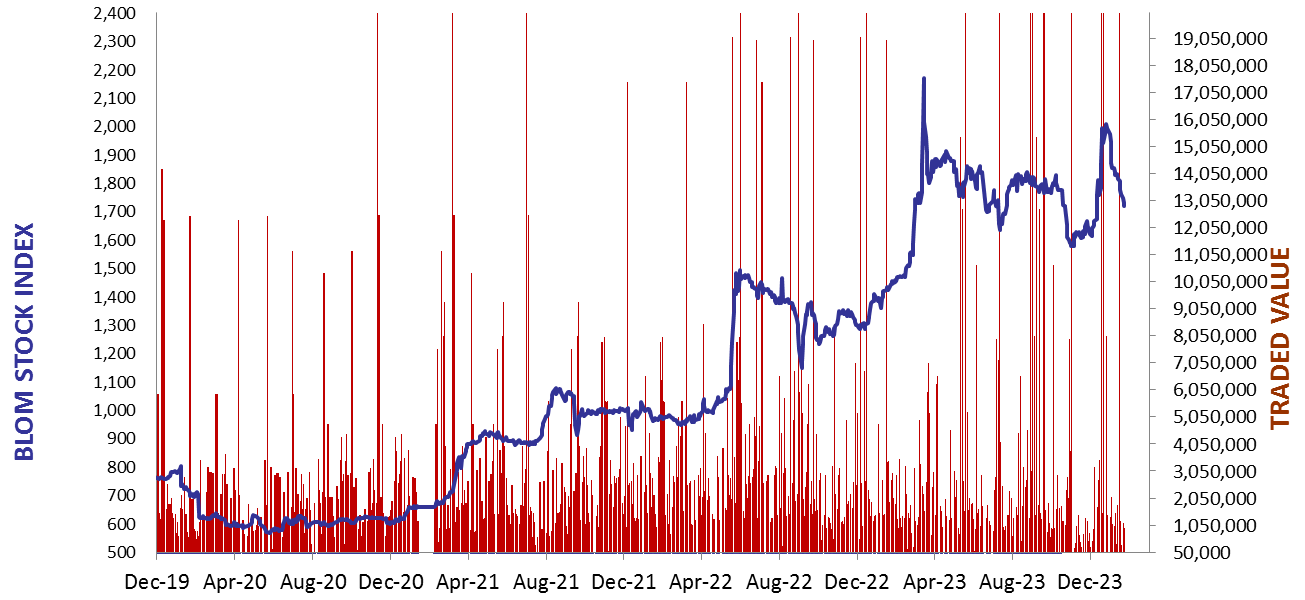
The BLOM Stock Index
BLOM BOND INDEX: Last Session’s Performance
| Last | Previous | Change | Y-t-D Change | ||
| BBI | 5.22 | 5.23 | -0.36% | -13.53% | |
| Weighted Yield | 201.81% | 201.20% | 60 | bps | |
| Duration (Years) | 1.21 | 1.22 | |||
| 5Y Bond Yield | 119.75% | 119.60% | 15 | bps | |
| 5Y Spread* | 11,507 | 11,487 | 20 | bps | |
| 10Y Bond Yield | 118.55% | 118.38% | 17 | bps | |
| 10Y Spread* | 11,459 | 11,433 | 26 | bps |
*spread between Lebanese Eurobonds and US Treasuries
| Price | Yield | Yield Change | |
| 26/02/2025 | 5.80 | 602.46% | 309 |
| 12/06/2025 | 5.83 | 413.65% | 114 |
| 28/11/2026 | 5.76 | 184.25% | 68 |
| 23/03/2027 | 5.76 | 170.85% | 0 |
| 29/11/2027 | 5.76 | 147.51% | 32 |
| 03/11/2028 | 5.73 | 129.77% | 20 |
| 26/02/2030 | 5.77 | 119.79% | 14 |
| 22/04/2031 | 5.78 | 119.20% | (69) |
| 23/03/2032 | 5.78 | 118.58% | 109 |
| 02/11/2035 | 5.74 | 118.62% | 21 |
| 23/03/2037 | 5.78 | 121.61% | (10) |
Closing Date: February 01, 2024
Lebanese Forex Market
| Last Price | Previous | % Change | |
| $/LBP | 15,000 | 15,000 | – |
| €/LBP | 16,303.50 | 16,308.00 | -0.03% |
| £/LBP | 19,110.00 | 19,113.00 | -0.02% |
| NEER | 243.08 | 243.02 | 0.02% |
Closing Date: February 02, 2024