
Discover today’s performance of BLOM indices, the closing prices of Lebanese stocks and Eurobonds, as well as the exchange rate of major currencies against the LBP.
BLOM Stock Index (BSI) – today’s performance
| Last | Previous | % Change | Y-t-D Change | |
| BSI | 1,902.89 | 1,935.99 | -1.71% | -3.55% |
| High | 1,959.53 | 1,953.30 | ||
| Low | 1,891.50 | 1,851.20 | ||
| Volume | 51,860 | 10,912 | ||
| Val ($) | 1,032,533 | 504,802 |
I): BLOM preferred Shares Index (BPSI): today’s Performance
| Last | Previous | Change | |
| BPSI | 39.62 | 39.62 | 0.00% |
| Volume | |||
| Value |
Lebanese Stocks: today’s Trades and Closing Prices
| Last Price ($) | % Change | Volume | VWAP ($) | |
| Solidere A | 85.2 | -1.39% | 7,510 | 85.18 |
| Solidere B | 83.55 | -3.69% | 4,350 | 83.59 |
| Byblos Listed shares | 0.73 | -2.67% | 40,000 | 0.7 |
Closing Date: February 12, 2024
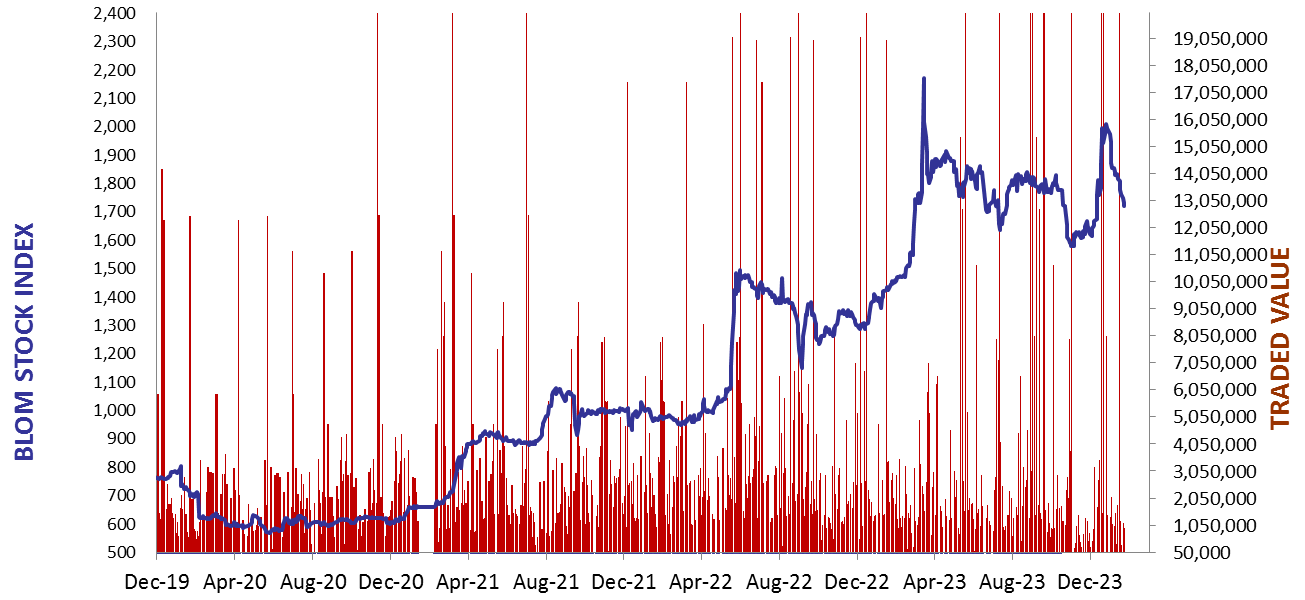
The BLOM Stock Index
BLOM BOND INDEX: Last Session’s Performance
| Last | Previous | Change | Y-t-D Change | ||
| BBI | 5.17 | 5.19 | -0.46% | -14.30% | |
| Weighted Yield | 206.00% | 204.55% | 144 | bps | |
| Duration (Years) | 1.18 | 1.19 | |||
| 5Y Bond Yield | 120.40% | 120.80% | -40 | bps | |
| 5Y Spread* | 11,557 | 11,597 | -40 | bps | |
| 10Y Bond Yield | 120.05% | 119.00% | 105 | bps | |
| 10Y Spread* | 11,583 | 11,484 | 99 | bps |
*spread between Lebanese Eurobonds and US Treasuries
| Price | Yield | Yield Change | |
| 26/02/2025 | 5.68 | 634.01% | 1,202 |
| 12/06/2025 | 5.91 | 417.40% | 149 |
| 28/11/2026 | 5.74 | 185.38% | 11 |
| 23/03/2027 | 5.64 | 174.12% | 71 |
| 29/11/2027 | 5.77 | 147.75% | 3 |
| 03/11/2028 | 5.67 | 131.08% | 29 |
| 26/02/2030 | 5.77 | 120.38% | 25 |
| 22/04/2031 | 5.66 | 121.43% | 45 |
| 23/03/2032 | 5.72 | 120.06% | 87 |
| 02/11/2035 | 5.66 | 120.24% | 138 |
| 23/03/2037 | 5.61 | 125.51% | 26 |
Closing Date: February 08, 2024
Lebanese Forex Market
| Last Price | Previous | % Change | |
| $/LBP | 15,000 | 15,000 | – |
| €/LBP | 16,189.50 | 16,173.00 | 0.10% |
| £/LBP | 18,951.00 | 18,939.00 | 0.06% |
| NEER | 243.74 | 243.55 | 0.08% |
Closing Date: February 12, 2024