
Discover today’s performance of BLOM indices, the closing prices of Lebanese stocks and Eurobonds, as well as the exchange rate of major currencies against the LBP.
BLOM Stock Index (BSI) – today’s performance
| Last | Previous | % Change | Y-t-D Change | |
| BSI | 1,714.03 | 1,720.83 | -0.40% | -13.13% |
| High | 1,720.83 | 1,752.91 | ||
| Low | 1,702.30 | 1,712.05 | ||
| Volume | 8,512 | 125,511 | ||
| Val ($) | 261,310 | 634,571 |
I): BLOM preferred Shares Index (BPSI): today’s Performance
| Last | Previous | Change | |
| BPSI | 39.62 | 39.62 | 0.00% |
| Volume | |||
| Value |
Lebanese Stocks: today’s Trades and Closing Prices
| Last Price ($) | % Change | Volume | VWAP ($) | |
| Solidere A | 73 | -2.54% | 3,012 | 73 |
| Solidere B | 75.85 | 2.50% | 500 | 75.87 |
| Byblos Bank – Listed Shares | 0.7 | 0.00% | 5,000 | 0.7 |
Closing Date: March 04, 2024
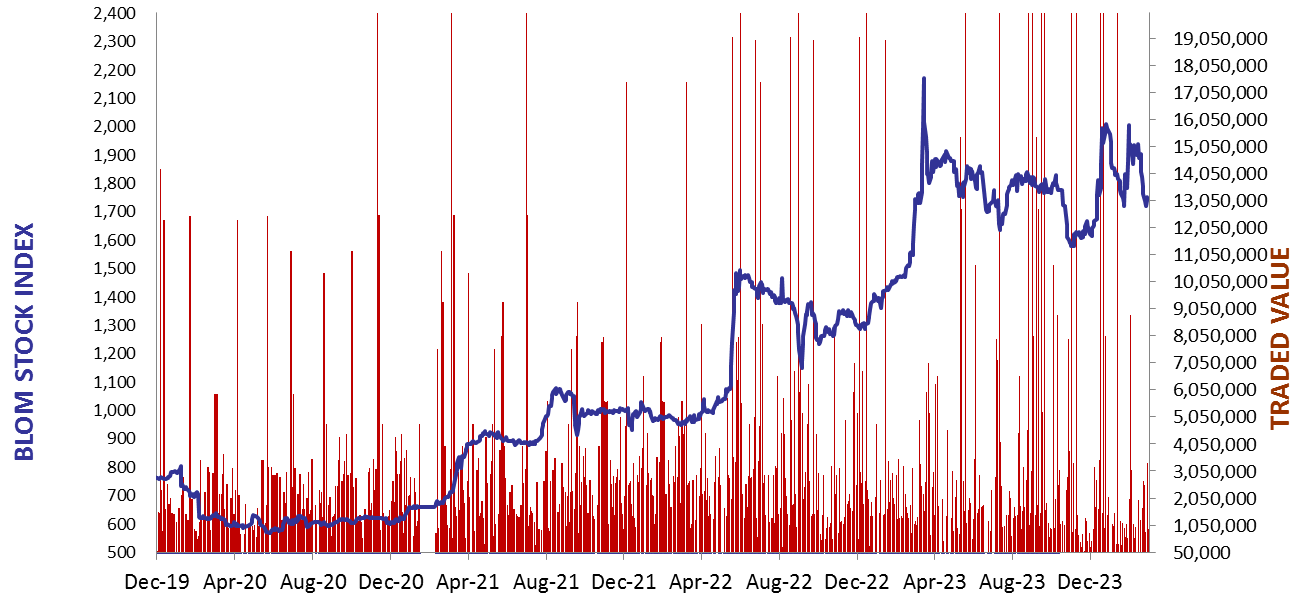
The BLOM Stock Index
BLOM BOND INDEX: Last Session’s Performance
| Last | Previous | Change | Y-t-D Change | ||
| BBI | 5.72 | 5.47 | 4.41% | -5.23% | |
| Weighted Yield | 202.47% | 207.48% | -501 | bps | |
| Duration (Years) | 1.29 | 1.26 | |||
| 5Y Bond Yield | 112.80% | 116.20% | -340 | bps | |
| 5Y Spread* | 10,786 | 11,119 | -333 | bps | |
| 10Y Bond Yield | 110.20% | 115.10% | -490 | bps | |
| 10Y Spread* | 10,588 | 11,067 | -479 | bps |
*spread between Lebanese Eurobonds and US Treasuries
| Price | Yield | Yield Change | |
| 26/02/2025 | 6.33 | 670.50% | (1,342) |
| 12/06/2025 | 6.42 | 423.40% | (410) |
| 28/11/2026 | 6.28 | 179.56% | (389) |
| 23/03/2027 | 6.31 | 167.05% | (418) |
| 29/11/2027 | 6.33 | 140.80% | (392) |
| 03/11/2028 | 6.32 | 122.74% | (377) |
| 26/02/2030 | 6.33 | 112.66% | (450) |
| 22/04/2031 | 6.31 | 111.05% | (419) |
| 23/03/2032 | 6.32 | 110.53% | (459) |
| 02/11/2035 | 6.33 | 108.50% | (476) |
| 23/03/2037 | 6.33 | 112.89% | (511) |
Closing Date: March 01, 2024
Lebanese Forex Market
| Last Price | Previous | % Change | |
| $/LBP | 15,000 | 15,000 | – |
| €/LBP | 16,248.00 | 16,255.50 | -0.05% |
| £/LBP | 18,972.00 | 18,975.00 | -0.02% |
| NEER | 239.85 | 239.70 | 0.06% |
Closing Date: March 04, 2024