
Discover today’s performance of BLOM indices, the closing prices of Lebanese stocks and Eurobonds, as well as the exchange rate of major currencies against the LBP.
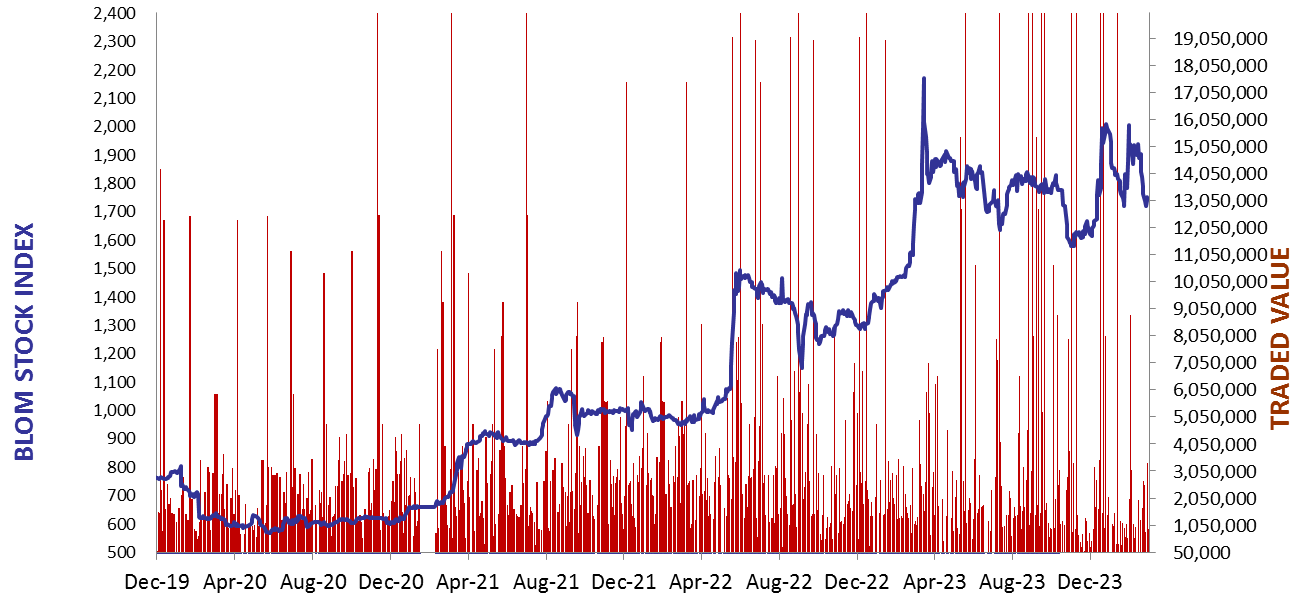
BLOM Stock Index (BSI) – today’s performance
| Last | Previous | % Change | Y-t-D Change | |
| BSI | 1,771.45 | 1,714.03 | 3.35% | -10.21% |
| High | 1,786.20 | 1,720.83 | ||
| Low | 1,714.03 | 1,702.30 | ||
| Volume | 9,400 | 8,512 | ||
| Val ($) | 387,454 | 261,310 |
I): BLOM preferred Shares Index (BPSI): today’s Performance
| Last | Previous | Change | |
| BPSI | 39.62 | 39.62 | 0.00% |
| Volume | |||
| Value |
Lebanese Stocks: today’s Trades and Closing Prices
| Last Price ($) | % Change | Volume | VWAP ($) | |
| Solidere A | 77.65 | 6.37% | 4,000 | 77.71 |
| Solidere B | 77.75 | 2.50% | 940 | 77.76 |
| Byblos Bank – Listed Shares | 0.7 | 0.00% | 5,000 | 0.7 |
Closing Date: March 05, 2024
The BLOM Stock Index
BLOM BOND INDEX: Last Session’s Performance
| Last | Previous | Change | Y-t-D Change | ||
| BBI | 5.89 | 5.72 | 3.07% | -2.31% | |
| Weighted Yield | 199.23% | 202.47% | -324 | bps | |
| Duration (Years) | 1.30 | 1.29 | |||
| 5Y Bond Yield | 109.60% | 112.80% | -320 | bps | |
| 5Y Spread* | 10,462 | 10,786 | -324 | bps | |
| 10Y Bond Yield | 107.80% | 110.20% | -240 | bps | |
| 10Y Spread* | 10,341 | 10,588 | -247 | bps |
*spread between Lebanese Eurobonds and US Treasuries
| Price | Yield | Yield Change | |
| 26/02/2025 | 6.54 | 662.72% | (779) |
| 12/06/2025 | 6.67 | 417.56% | (584) |
| 28/11/2026 | 6.46 | 177.25% | (231) |
| 23/03/2027 | 6.50 | 164.75% | (230) |
| 29/11/2027 | 6.51 | 138.59% | (221) |
| 03/11/2028 | 6.51 | 120.46% | (228) |
| 26/02/2030 | 6.51 | 110.02% | (264) |
| 22/04/2031 | 6.51 | 108.20% | (285) |
| 23/03/2032 | 6.51 | 107.78% | (275) |
| 02/11/2035 | 6.52 | 105.59% | (291) |
| 23/03/2037 | 6.54 | 109.49% | (341) |
Closing Date: March 04, 2024
Lebanese Forex Market
| Last Price | Previous | % Change | |
| $/LBP | 15,000 | 15,000 | – |
| €/LBP | 16,272.00 | 16,281.00 | -0.06% |
| £/LBP | 19,014.00 | 19,035.00 | -0.11% |
| NEER | 240.16 | 239.85 | 0.13% |
Closing Date: March 05, 2024