
Discover today’s performance of BLOM indices, the closing prices of Lebanese stocks and Eurobonds, as well as the exchange rate of major currencies against the LBP.
BLOM Stock Index (BSI) – today’s performance
| Last | Previous | % Change | Y-t-D Change | |
| BSI | 1,718.61 | 1,719.87 | -0.07% | -12.89% |
| High | 1,759.10 | 1,771.45 | ||
| Low | 1,718.61 | 1,696.62 | ||
| Volume | 21,741 | 46,217 | ||
| Val ($) | 145,229 | 1,068,904 |
I): BLOM preferred Shares Index (BPSI): today’s Performance
| Last | Previous | Change | |
| BPSI | 39.62 | 39.62 | 0.00% |
| Volume | |||
| Value |
Lebanese Stocks: today’s Trades and Closing Prices
| Last Price ($) | % Change | Volume | VWAP ($) | |
| Solidere A | 75.75 | -0.20% | 1,740 | 75.76 |
| Byblos Bank – Listed Shares | 0.67 | 0.00% | 20,000 | 0.7 |
| BLOM Listed Shares | 2.81 | 0.36% | 1 | 2.8 |
Closing Date: March 07, 2024
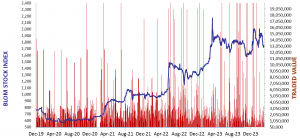
The BLOM Stock Index
BLOM BOND INDEX: Last Session’s Performance
| Last | Previous | Change | Y-t-D Change | ||
| BBI | 5.89 | 5.89 | 0.08% | -2.33% | |
| Weighted Yield | 200.17% | 199.70% | 48 | bps | |
| Duration (Years) | 1.30 | 1.30 | |||
| 5Y Bond Yield | 109.60% | 109.60% | 0 | bps | |
| 5Y Spread* | 10,465 | 10,466 | -1 | bps | |
| 10Y Bond Yield | 108.00% | 107.85% | 15 | bps | |
| 10Y Spread* | 10,368 | 10,353 | 15 | bps |
*spread between Lebanese Eurobonds and US Treasuries
| Price | Yield | Yield Change | |
| 26/02/2025 | 6.49 | 672.02% | 712 |
| 12/06/2025 | 6.72 | 418.31% | (116) |
| 28/11/2026 | 6.47 | 177.47% | (5) |
| 23/03/2027 | 6.49 | 165.22% | 18 |
| 29/11/2027 | 6.52 | 138.67% | (8) |
| 03/11/2028 | 6.49 | 120.73% | 12 |
| 26/02/2030 | 6.52 | 109.91% | (19) |
| 22/04/2031 | 6.51 | 108.34% | 4 |
| 23/03/2032 | 6.50 | 108.00% | 13 |
| 02/11/2035 | 6.52 | 105.54% | (18) |
| 23/03/2037 | 6.54 | 109.70% | 14 |
Closing Date: March 06, 2024
Lebanese Forex Market
| Last Price | Previous | % Change | |
| $/LBP | 15,000 | 15,000 | – |
| €/LBP | 16,353.00 | 16,345.50 | 0.05% |
| £/LBP | 19,111.50 | 19,093.50 | 0.09% |
| NEER | 240.61 | 240.28 | 0.14% |
Closing Date: March 07, 2024