
Discover today’s performance of BLOM indices, the closing prices of Lebanese stocks and Eurobonds, as well as the exchange rate of major currencies against the LBP.
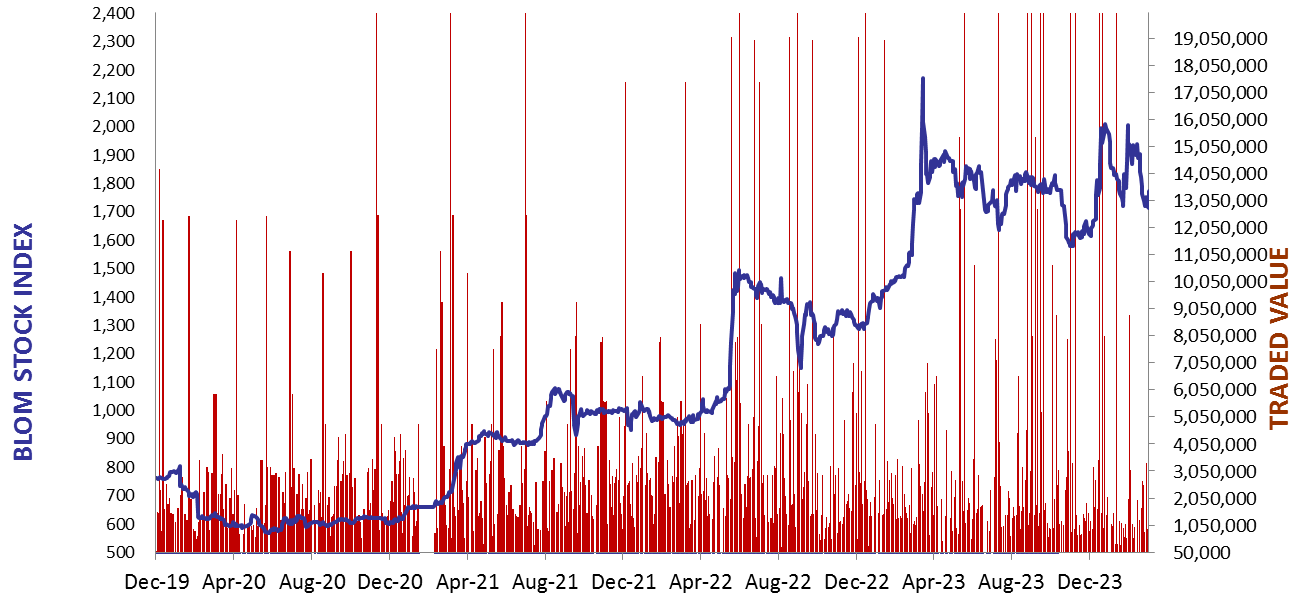
BLOM Stock Index (BSI) – today’s performance
| Last | Previous | % Change | Y-t-D Change | |
| BSI | 1,688.98 | 1,687.20 | 0.11% | -14.39% |
| High | 1,697.50 | 1,739.81 | ||
| Low | 1,687.20 | 1,687.20 | ||
| Volume | 15,120 | 221,870 | ||
| Val ($) | 979,535 | 1,619,835 |
I): BLOM preferred Shares Index (BPSI): today’s Performance
| Last | Previous | Change | |
| BPSI | 35.15 | 39.62 | -11.28% |
| Volume | 9,390 | ||
| Value | 201,416 |
Lebanese Stocks: today’s Trades and Closing Prices
| Last Price ($) | % Change | Volume | VWAP ($) | |
| Solidere A | 74.15 | 0.20% | 5,110 | 74.13 |
| Solidere B | 73.5 | 0.07% | 10 | 73.5 |
| HOLCIM | 60 | 0.00% | 10,000 | 60 |
Closing Date: April 09, 2024
The BLOM Stock Index
BLOM BOND INDEX: Last Session’s Performance
| Last | Previous | Change | Y-t-D Change | ||
| BBI | 5.96 | 5.96 | 0.03% | -1.21% | |
| Weighted Yield | 212.01% | 211.58% | 44 | bps | |
| Duration (Years) | 1.36 | 1.38 | |||
| 5Y Bond Yield | 108.70% | 108.55% | 15 | bps | |
| 5Y Spread* | 10,363 | 10,350 | 13 | bps | |
| 10Y Bond Yield | 108.20% | 107.65% | 55 | bps | |
| 10Y Spread* | 10,360 | 10,311 | 49 | bps |
*spread between Lebanese Eurobonds and US Treasuries
| Price | Yield | Yield Change | |
| 26/02/2025 | 6.64 | 761.71% | (117) |
| 12/06/2025 | 6.80 | 461.91% | 203 |
| 28/11/2026 | 6.63 | 181.02% | 2 |
| 23/03/2027 | 6.57 | 168.58% | 70 |
| 29/11/2027 | 6.58 | 140.67% | 68 |
| 03/11/2028 | 6.51 | 122.77% | 94 |
| 26/02/2030 | 6.56 | 108.79% | 27 |
| 22/04/2031 | 6.59 | 108.74% | 38 |
| 23/03/2032 | 6.52 | 108.00% | 78 |
| 02/11/2035 | 6.52 | 106.73% | 110 |
| 23/03/2037 | 6.59 | 109.15% | (42) |
Closing Date: April 08, 2024
Lebanese Forex Market
| Last Price | Previous | % Change | |
| $/LBP | 15,000 | 15,000 | – |
| €/LBP | 16,285.50 | 16,287.00 | -0.01% |
| £/LBP | 18,990.00 | 18,978.00 | 0.06% |
| NEER | 241.41 | 240.93 | 0.20% |
Closing Date: April 09, 2024