
Discover today’s performance of BLOM indices, the closing prices of Lebanese stocks and Eurobonds, as well as the exchange rate of major currencies against the LBP.
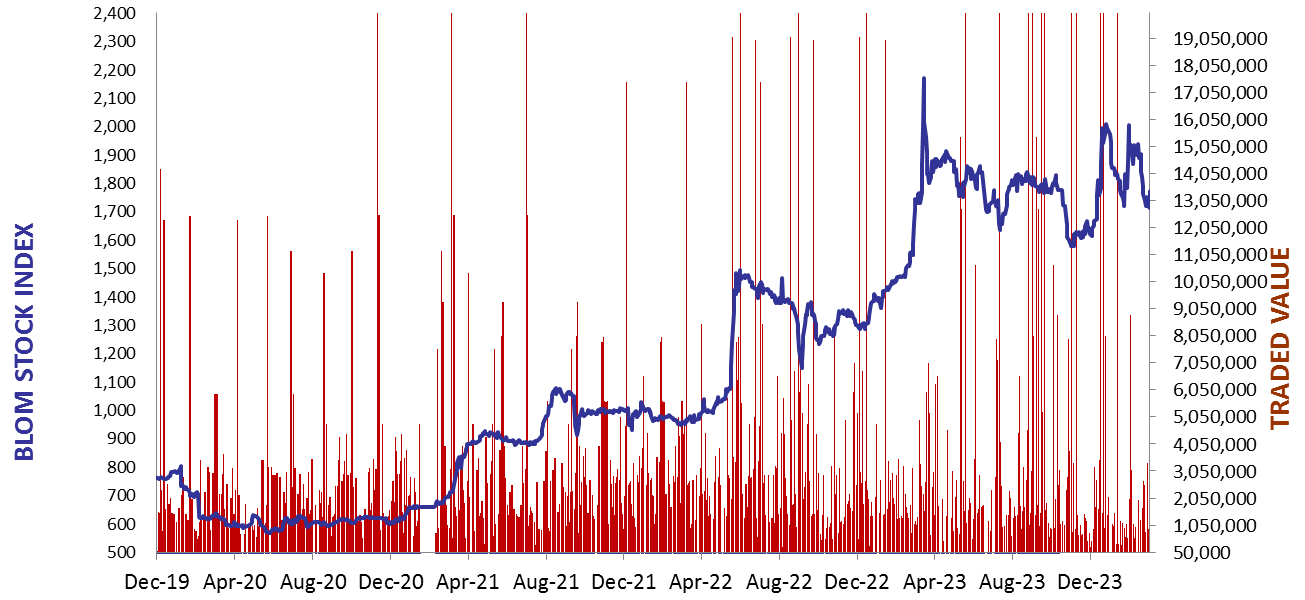
BLOM Stock Index (BSI) – today’s performance
| Last | Previous | % Change | Y-t-D Change | |
| BSI | 1,727.81 | 1,705.41 | 1.31% | -12.43% |
| High | 1,727.81 | 1,724.92 | ||
| Low | 1,705.41 | 1,697.12 | ||
| Volume | 28,071 | 8,370 | ||
| Val ($) | 1,451,381 | 614,036 |
I): BLOM preferred Shares Index (BPSI): today’s Performance
| Last | Previous | Change | |
| BPSI | 39.62 | 39.62 | 0.00% |
| Volume | |||
| Value |
Lebanese Stocks: today’s Trades and Closing Prices
| Last Price ($) | % Change | Volume | VWAP ($) | |
| Solidere A | 75 | 2.81% | 3,140 | 74.99 |
| Solidere B | 75 | 0.00% | 1,595 | 75 |
| Byblos Bank – Listed Shares | 0.69 | 6.15% | 5,000 | 0.7 |
| HOLCIM | 59.60 | 0.17% | 18,336 | 59.60 |
Closing Date: March 13, 2024
The BLOM Stock Index
BLOM BOND INDEX: Last Session’s Performance
| Last | Previous | Change | Y-t-D Change | ||
| BBI | 6.05 | 6.05 | -0.14% | 0.25% | |
| Weighted Yield | 199.17% | 198.41% | 76 | bps | |
| Duration (Years) | 1.30 | 1.30 | |||
| 5Y Bond Yield | 107.20% | 107.00% | 20 | bps | |
| 5Y Spread* | 10,220 | 10,205 | 15 | bps | |
| 10Y Bond Yield | 105.70% | 105.80% | -10 | bps | |
| 10Y Spread* | 10,137 | 10,154 | -17 | bps |
*spread between Lebanese Eurobonds and US Treasuries
| Price | Yield | Yield Change | |
| 26/02/2025 | 6.64 | 677.46% | 747 |
| 12/06/2025 | 6.83 | 421.82% | (25) |
| 28/11/2026 | 6.66 | 175.60% | 41 |
| 23/03/2027 | 6.70 | 163.39% | 39 |
| 29/11/2027 | 6.69 | 136.96% | 5 |
| 03/11/2028 | 6.68 | 118.77% | 13 |
| 26/02/2030 | 6.69 | 107.57% | 2 |
| 22/04/2031 | 6.70 | 105.89% | 16 |
| 23/03/2032 | 6.69 | 105.51% | (29) |
| 02/11/2035 | 6.67 | 103.44% | 45 |
| 23/03/2037 | 6.69 | 107.69% | 66 |
Closing Date: March 12, 2024
Lebanese Forex Market
| Last Price | Previous | % Change | |
| $/LBP | 15,000 | 15,000 | – |
| €/LBP | 16,392.00 | 16,386.00 | 0.04% |
| £/LBP | 19,191.00 | 19,186.50 | 0.02% |
| NEER | 240.92 | 240.83 | 0.04% |
Closing Date: March 13, 2024