
Discover today’s performance of BLOM indices, the closing prices of Lebanese stocks and Eurobonds, as well as the exchange rate of major currencies against the LBP.
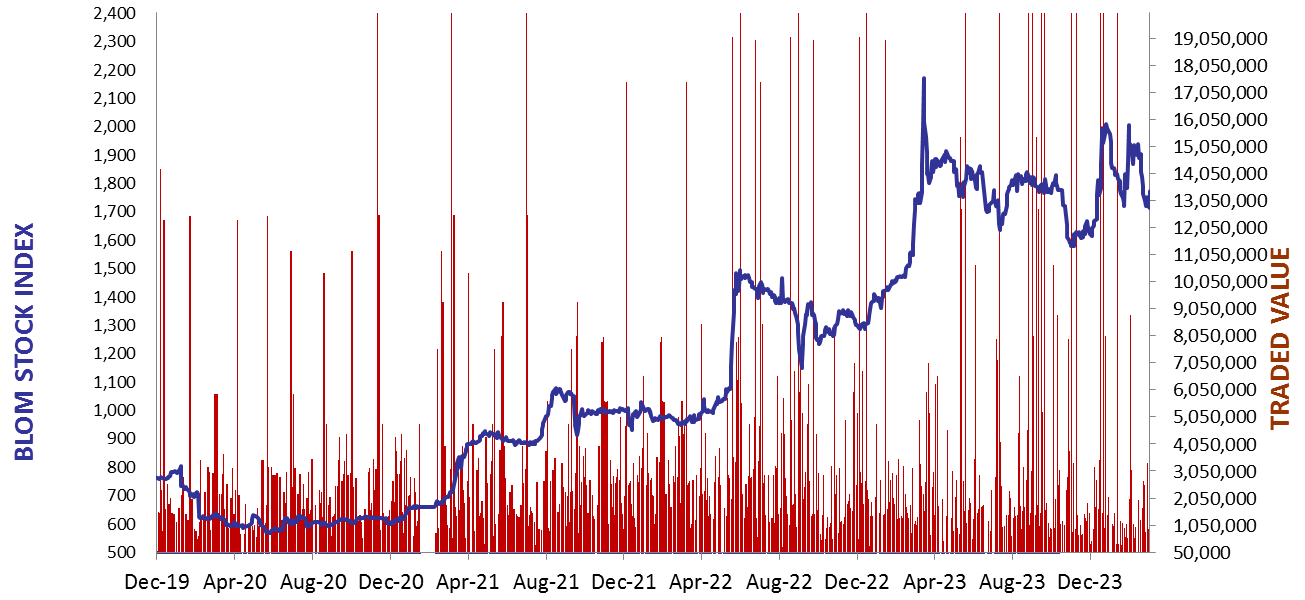
BLOM Stock Index (BSI) – today’s performance
| Last | Previous | % Change | Y-t-D Change | |
| BSI | 1,712.27 | 1,710.80 | 0.09% | -13.21% |
| High | 1,719.87 | 1,716.97 | ||
| Low | 1,695.38 | 1,703.63 | ||
| Volume | 44,544 | 53,654 | ||
| Val ($) | 359,141 | 1,414,120 |
I): BLOM preferred Shares Index (BPSI): today’s Performance
| Last | Previous | Change | |
| BPSI | 39.62 | 39.62 | 0.00% |
| Volume | |||
| Value |
Lebanese Stocks: today’s Trades and Closing Prices
| Last Price ($) | % Change | Volume | VWAP ($) | |
| Solidere A | 74.7 | 0.67% | 1,501 | 74.69 |
| Solidere B | 74.3 | -0.60% | 3,043 | 73.7 |
| Byblos Bank – Listed Shares | 0.57 | -1.72% | 40,000 | 0.6 |
Closing Date: March 21, 2024
The BLOM Stock Index
BLOM BOND INDEX: Last Session’s Performance
| Last | Previous | Change | Y-t-D Change | ||
| BBI | 5.96 | 6.00 | -0.56% | -1.14% | |
| Weighted Yield | 204.38% | 203.25% | 113 | bps | |
| Duration (Years) | 1.26 | 1.27 | |||
| 5Y Bond Yield | 108.30% | 108.00% | 30 | bps | |
| 5Y Spread* | 10,329 | 10,294 | 35 | bps | |
| 10Y Bond Yield | 107.55% | 106.80% | 75 | bps | |
| 10Y Spread* | 10,314 | 10,233 | 81 | bps |
*spread between Lebanese Eurobonds and US Treasuries
| Price | Yield | Yield Change | |
| 26/02/2025 | 6.57 | 705.70% | 342 |
| 12/06/2025 | 6.73 | 436.74% | 380 |
| 28/11/2026 | 6.58 | 178.32% | 127 |
| 23/03/2027 | 6.57 | 167.03% | 55 |
| 29/11/2027 | 6.62 | 138.47% | 35 |
| 03/11/2028 | 6.57 | 120.71% | 41 |
| 26/02/2030 | 6.61 | 108.30% | 25 |
| 22/04/2031 | 6.56 | 108.13% | 39 |
| 23/03/2032 | 6.60 | 107.46% | 79 |
| 02/11/2035 | 6.56 | 105.29% | 52 |
| 23/03/2037 | 6.60 | 109.70% | 94 |
Closing Date: March 20, 2024
Lebanese Forex Market
| Last Price | Previous | % Change | |
| $/LBP | 15,000 | 15,000 | – |
| €/LBP | 16,404.00 | 16,377.00 | 0.16% |
| £/LBP | 19,191.00 | 19,176.00 | 0.08% |
| NEER | 241.41 | 241.80 | -0.16% |
Closing Date: March 21, 2024